
Question-by-question working
Read the prompt, attempt it, then check each step
Every exercise subpart and table row is a separate item. Shared figures and table headings are repeated whenever they are needed to understand the question.
Detailed worked answers
Textbook page 179
Textbook page 179 · solved item 1
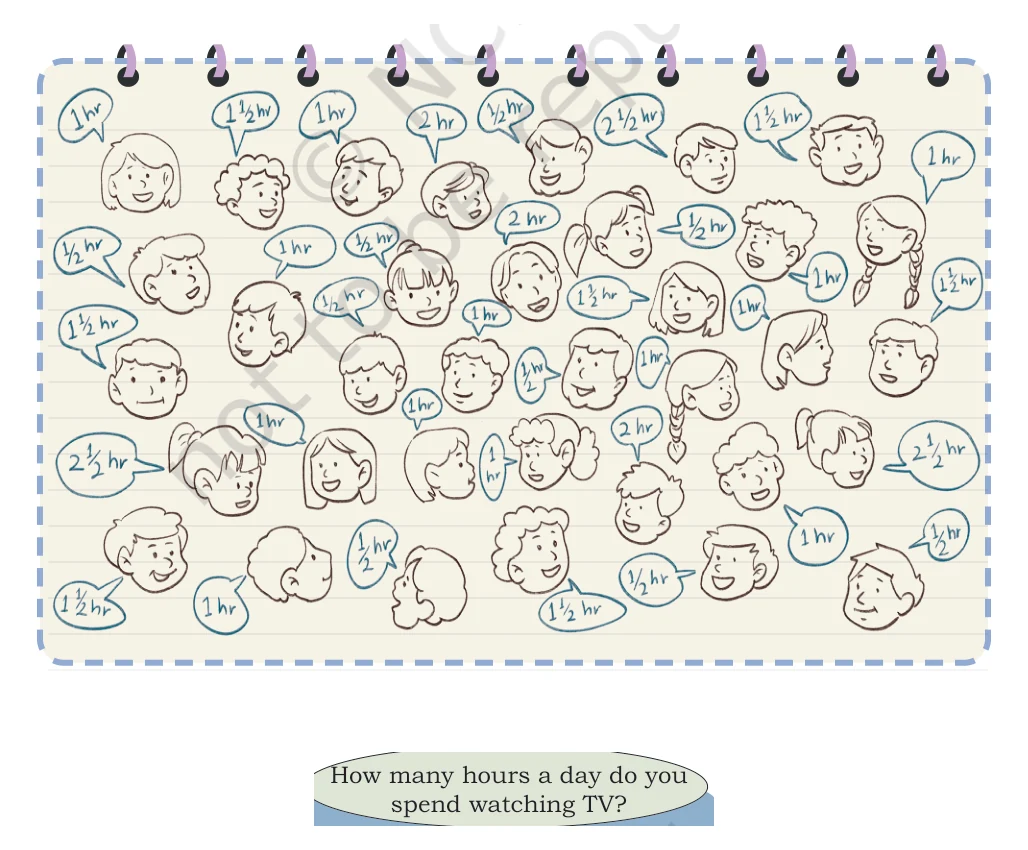
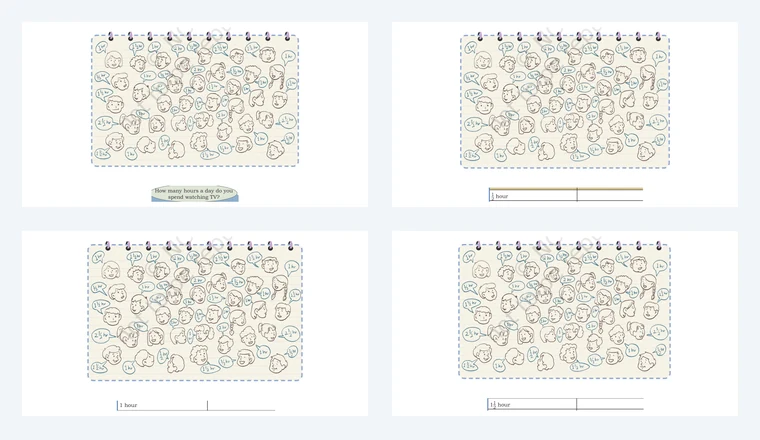
How many hours a day do you spend watching TV?
Show detailed solution
- Step 1: Think about a usual day rather than a day with an unusual event.
- Step 2: Add the time from every TV-watching session during that day.
- Step 3: Record the total in hours and minutes so it can be compared with the class data.
- Answer: Answers will differ. For example, a learner who watches for 30 minutes can record half an hour.
Detailed worked answers
Textbook page 180
Textbook page 180 · solved item 2
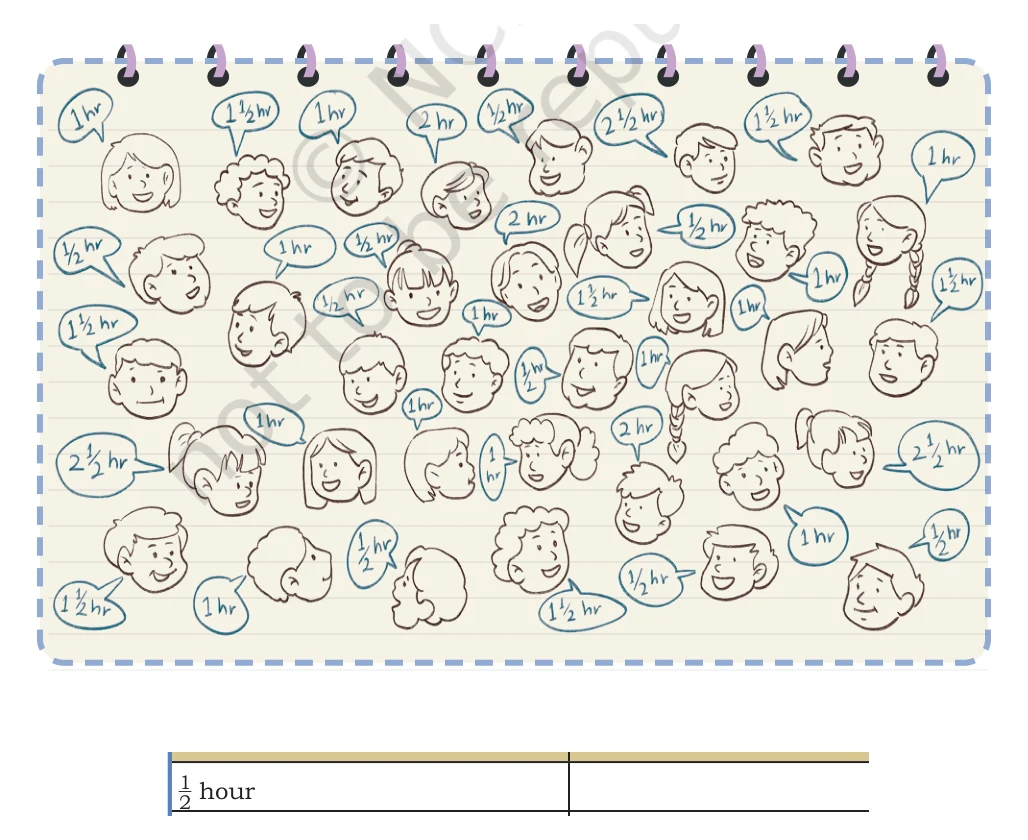
Complete the table row for children who watch TV for half an hour.
Show detailed solution
- Step 1: Look through all 35 speech bubbles and mark each response that says half an hour.
- Step 2: Count the marked responses carefully. There are 8.
- Step 3: Check the five row counts together; they should total 35 children.
- Answer: Write 8 in this row.
Textbook page 180 · solved item 3
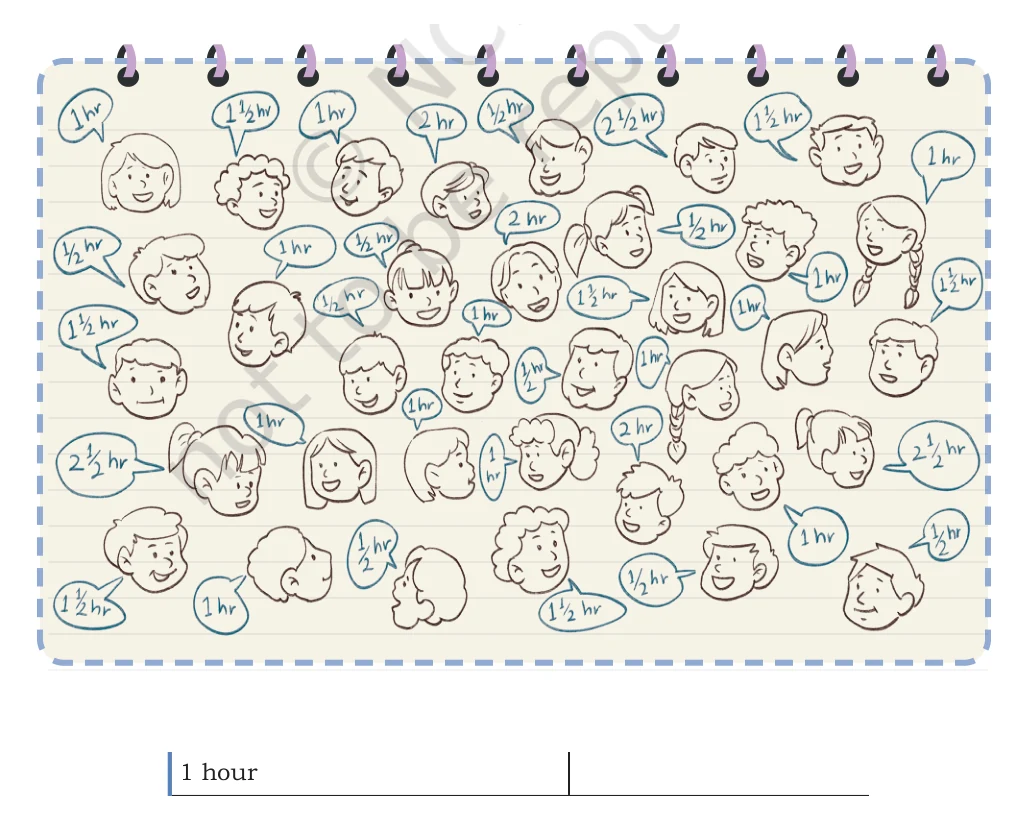
Complete the table row for children who watch TV for 1 hour.
Show detailed solution
- Step 1: Look through all 35 speech bubbles and mark each response that says 1 hour.
- Step 2: Count the marked responses carefully. There are 13.
- Step 3: Check the five row counts together; they should total 35 children.
- Answer: Write 13 in this row.
Textbook page 180 · solved item 4
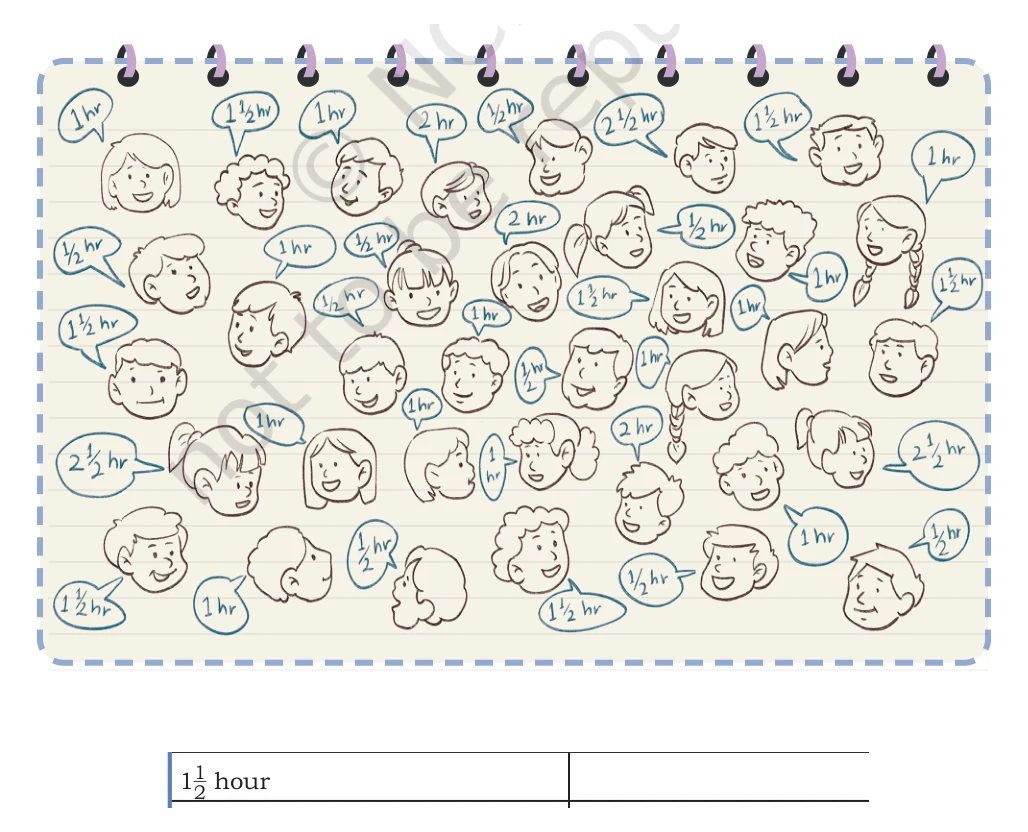
Complete the table row for children who watch TV for one and a half hours.
Show detailed solution
- Step 1: Look through all 35 speech bubbles and mark each response that says one and a half hours.
- Step 2: Count the marked responses carefully. There are 8.
- Step 3: Check the five row counts together; they should total 35 children.
- Answer: Write 8 in this row.
Textbook page 180 · solved item 5
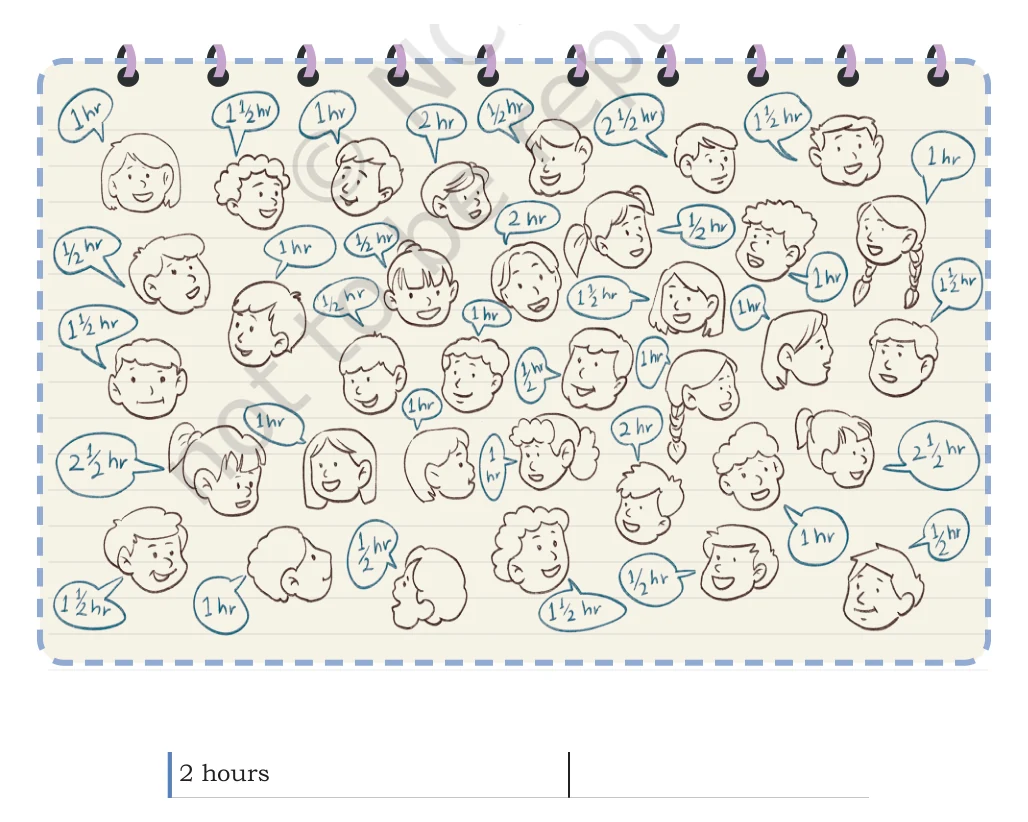
Complete the table row for children who watch TV for 2 hours.
Show detailed solution
- Step 1: Look through all 35 speech bubbles and mark each response that says 2 hours.
- Step 2: Count the marked responses carefully. There are 3.
- Step 3: Check the five row counts together; they should total 35 children.
- Answer: Write 3 in this row.
Textbook page 180 · solved item 6
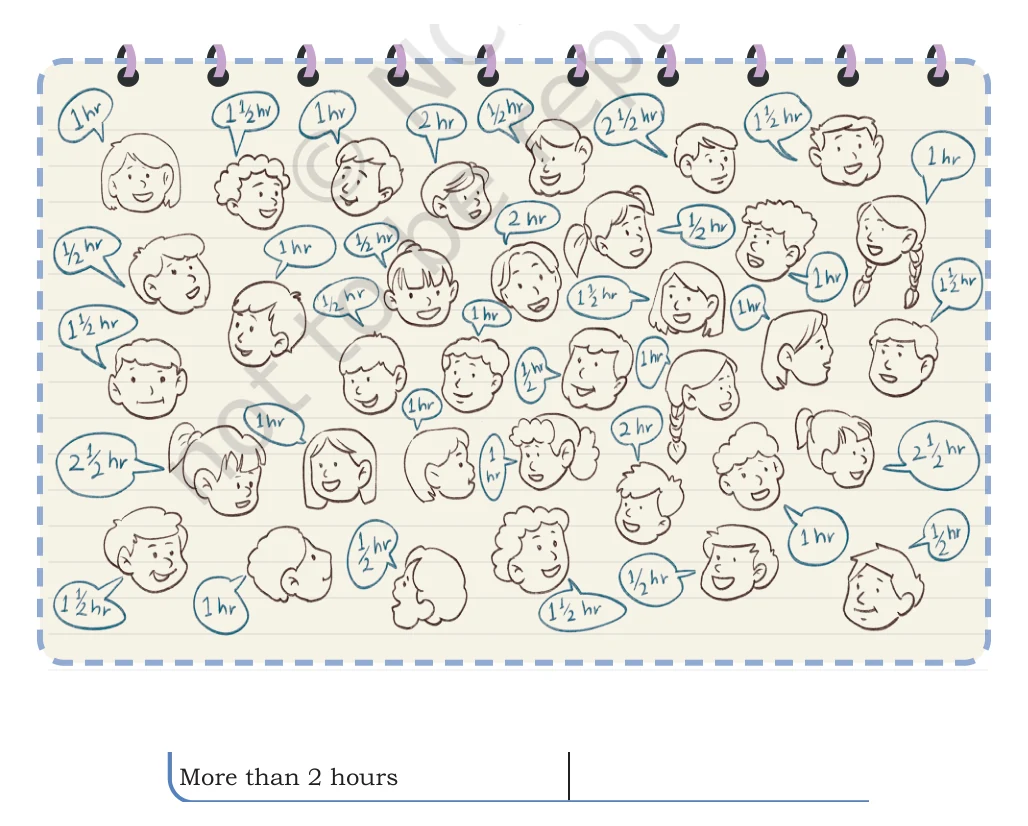
Complete the table row for children who watch TV for more than 2 hours.
Show detailed solution
- Step 1: Look through all 35 speech bubbles and mark each response that says more than 2 hours.
- Step 2: Count the marked responses carefully. There are 3.
- Step 3: Check the five row counts together; they should total 35 children.
- Answer: Write 3 in this row.
Textbook page 180 · solved item 7
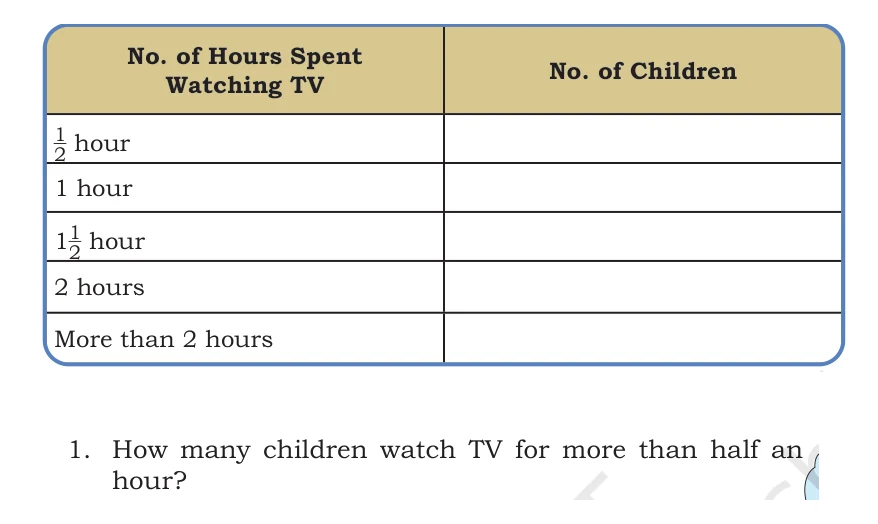
How many children watch TV for more than half an hour?
Show detailed solution
- Step 1: Leave out only the 8 children in the half-hour row.
- Step 2: Add the other rows: 13+8+3+3=27.
- Step 3: Check that only the rows named in the question were used.
- Answer: 27 children.
Textbook page 180 · solved item 8
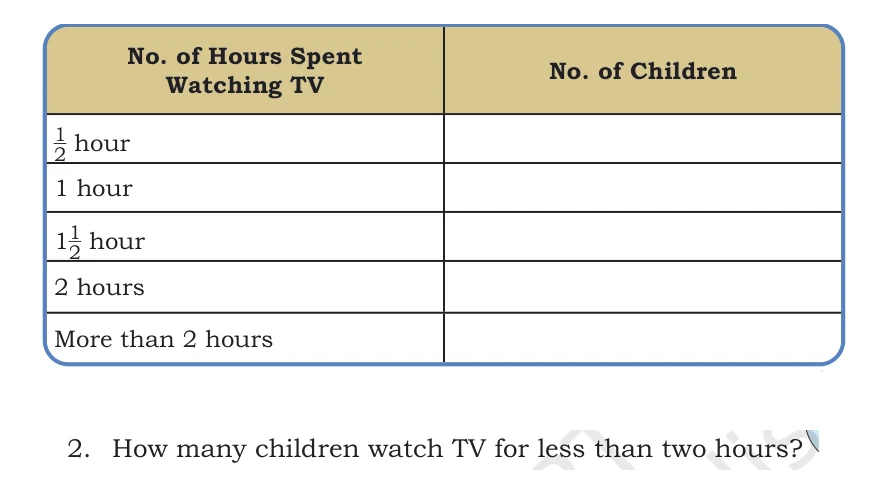
How many children watch TV for less than two hours?
Show detailed solution
- Step 1: Use the half-hour, 1-hour, and one-and-a-half-hour rows.
- Step 2: Add their counts: 8+13+8=29.
- Step 3: Check that only the rows named in the question were used.
- Answer: 29 children.
Textbook page 180 · solved item 9
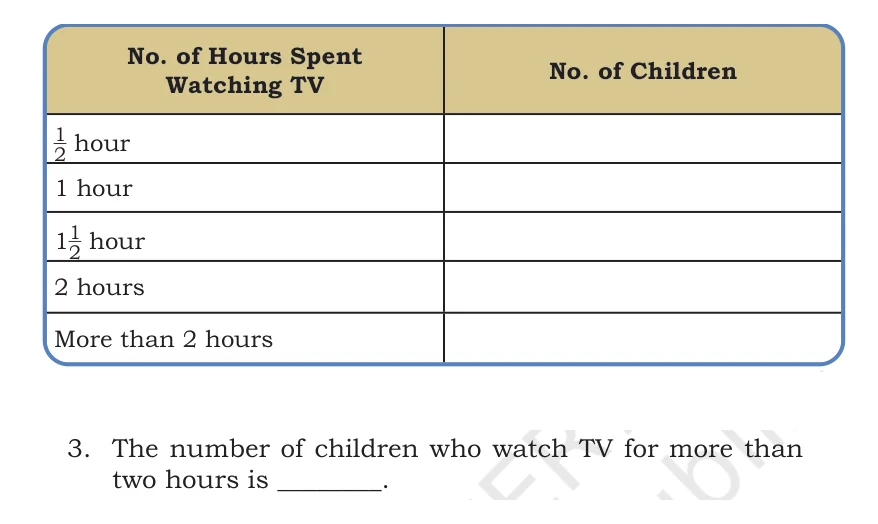
How many children watch TV for more than two hours?
Show detailed solution
- Step 1: Find the row labelled more than 2 hours.
- Step 2: Its completed count is 3.
- Step 3: Check that only the rows named in the question were used.
- Answer: 3 children.
Textbook page 180 · solved item 10
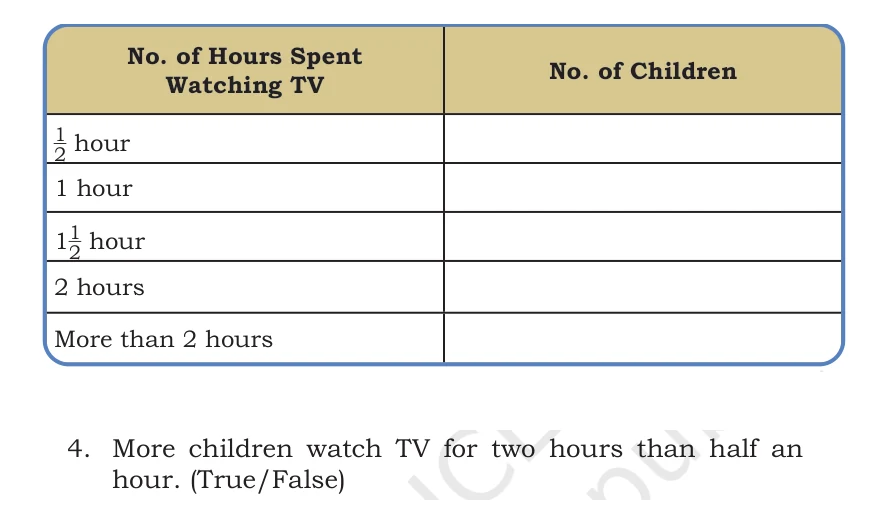
Is it true that more children watch TV for two hours than for half an hour?
Show detailed solution
- Step 1: The 2-hour row has 3 children.
- Step 2: The half-hour row has 8 children, and 3 is less than 8.
- Step 3: Check that only the rows named in the question were used.
- Answer: False.
Textbook page 180 · solved item 11
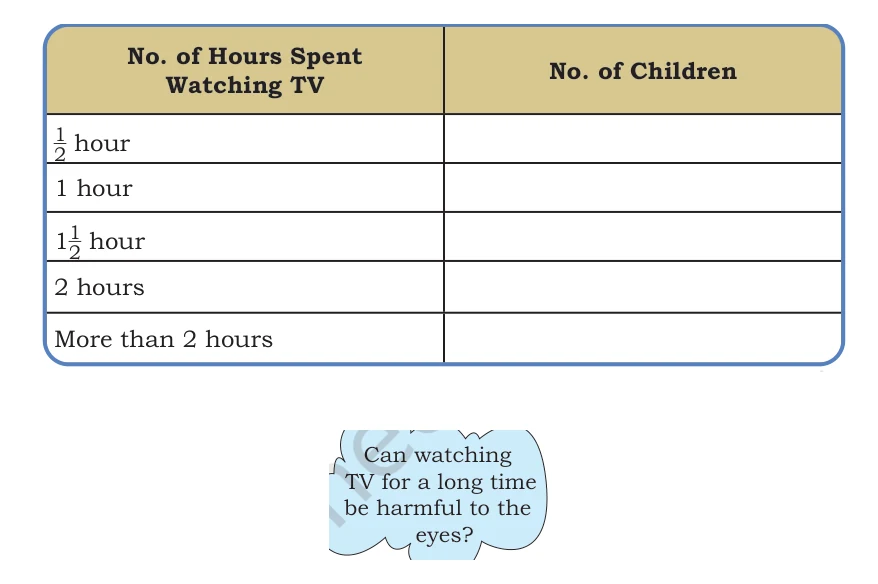
Can watching TV for a long time be harmful to the eyes?
Show detailed solution
- Step 1: Looking at a screen continuously can make the eyes feel tired or dry.
- Step 2: Long screen time can also replace sleep, outdoor play, and movement.
- Step 3: Take regular breaks, keep a sensible distance, and follow an adult's screen-time rules.
- Answer: Yes, very long or continuous screen time can cause eye strain, so breaks and balanced activities are important.
Textbook page 180 · solved item 12
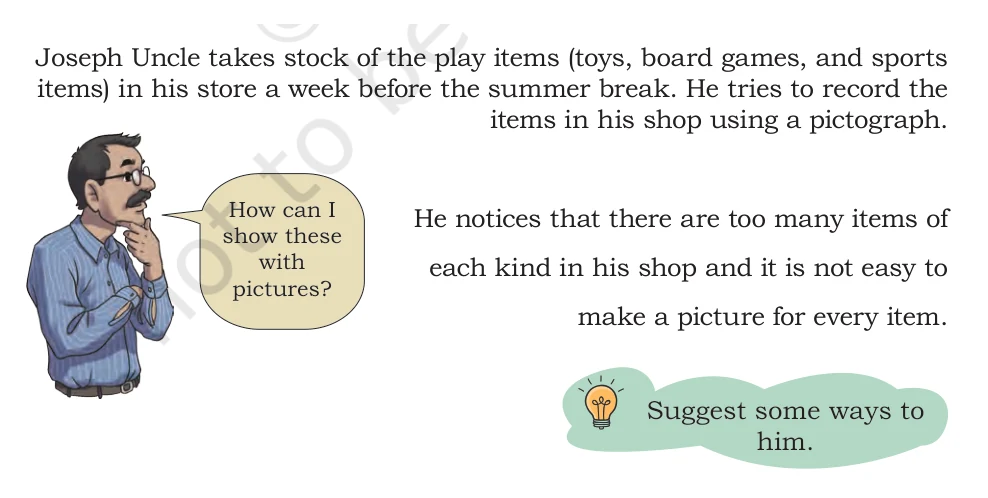
How can Joseph Uncle show many shop items using fewer pictures?
Show detailed solution
- Step 1: Choose one simple picture for each kind of item.
- Step 2: Let one picture stand for a group, such as 5 items, instead of just one item.
- Step 3: Write the meaning of each picture in a key so readers can find the real totals.
- Answer: Make a pictograph with a scale, for example one picture represents 5 items.
Detailed worked answers
Textbook page 181
Textbook page 181 · solved item 13
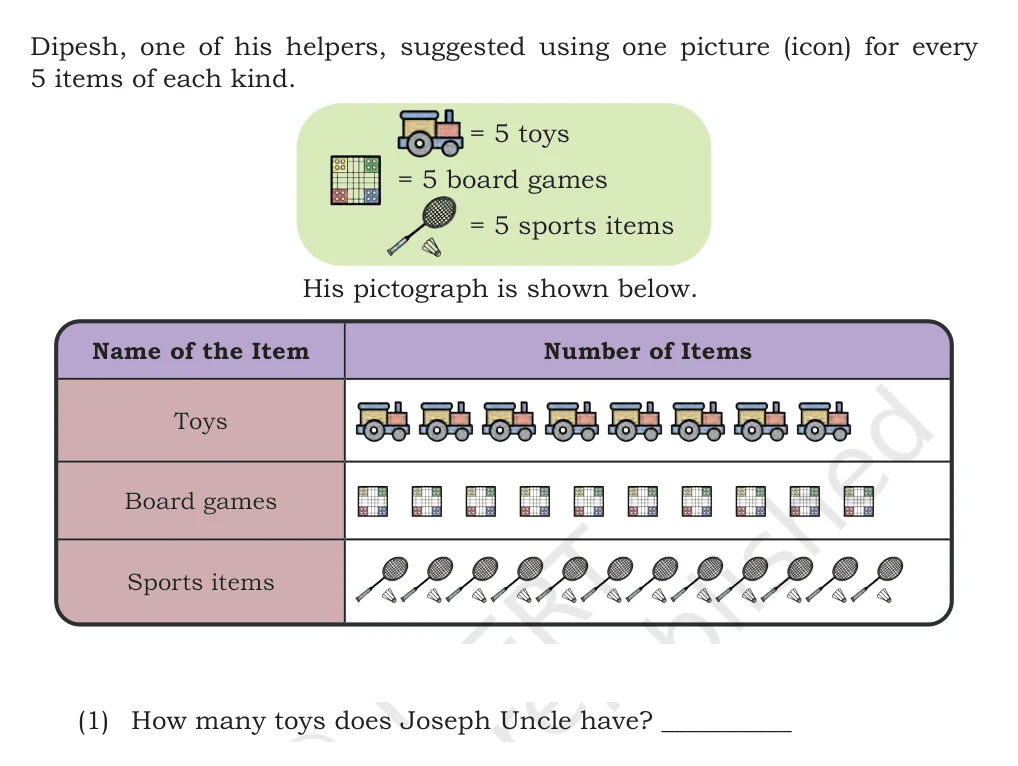
How many toys does Joseph Uncle have?
Show detailed solution
- Step 1: Count the 8 toy icons in the matching row.
- Step 2: The key says each icon represents 5 items.
- Step 3: Multiply: 8\times5=40.
- Answer: 40 toys.
Textbook page 181 · solved item 14
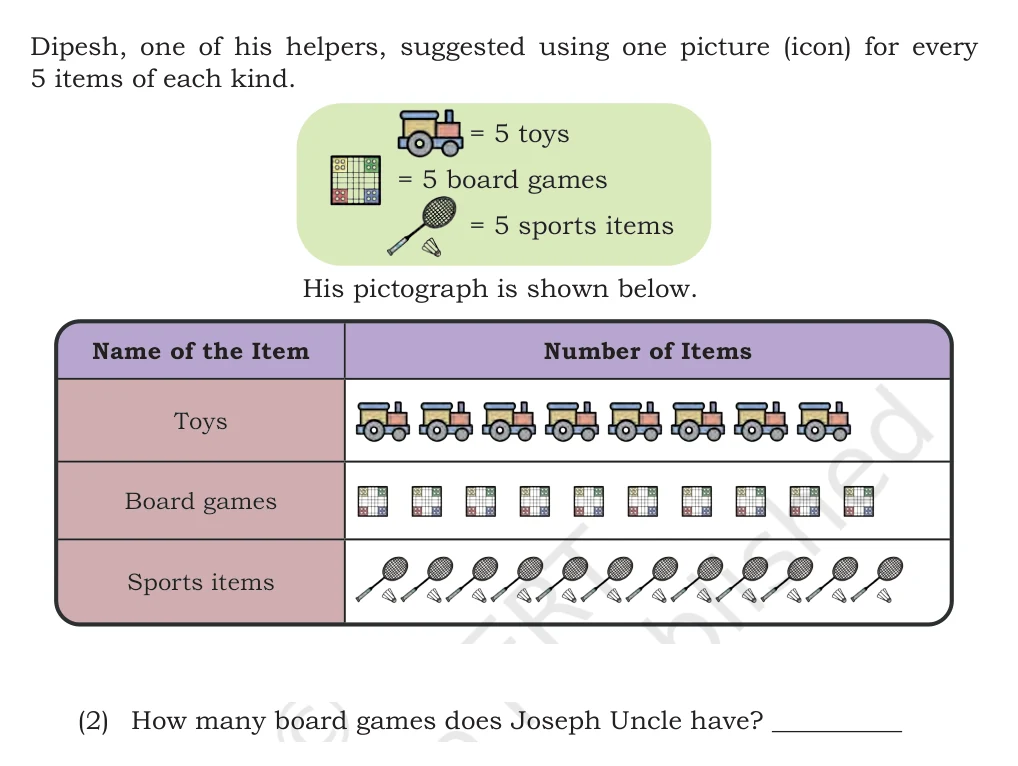
How many board games does Joseph Uncle have?
Show detailed solution
- Step 1: Count the 10 board-game icons in the matching row.
- Step 2: The key says each icon represents 5 items.
- Step 3: Multiply: 10\times5=50.
- Answer: 50 board games.
Textbook page 181 · solved item 15
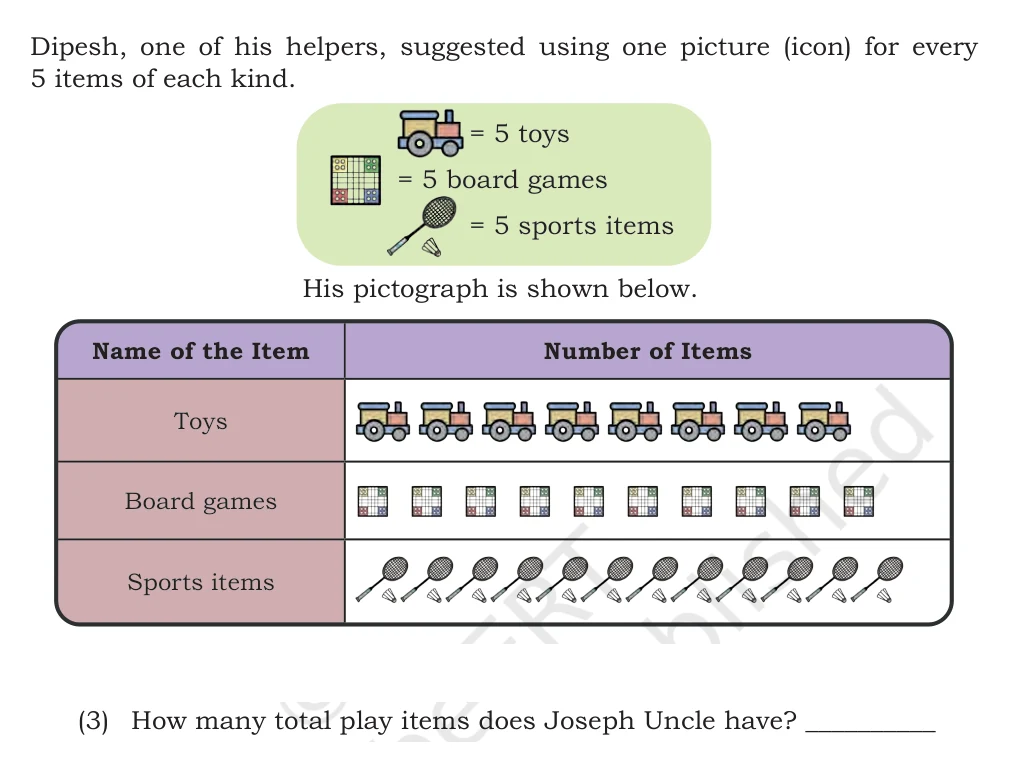
How many total play items does Joseph Uncle have?
Show detailed solution
- Step 1: Count 8 toy icons, 10 board-game icons, and 12 sports-item icons.
- Step 2: Each icon represents 5 items, so the row totals are 40, 50, and 60.
- Step 3: Add the three totals: 40+50+60=150.
- Answer: 150 play items.
Textbook page 181 · solved item 16
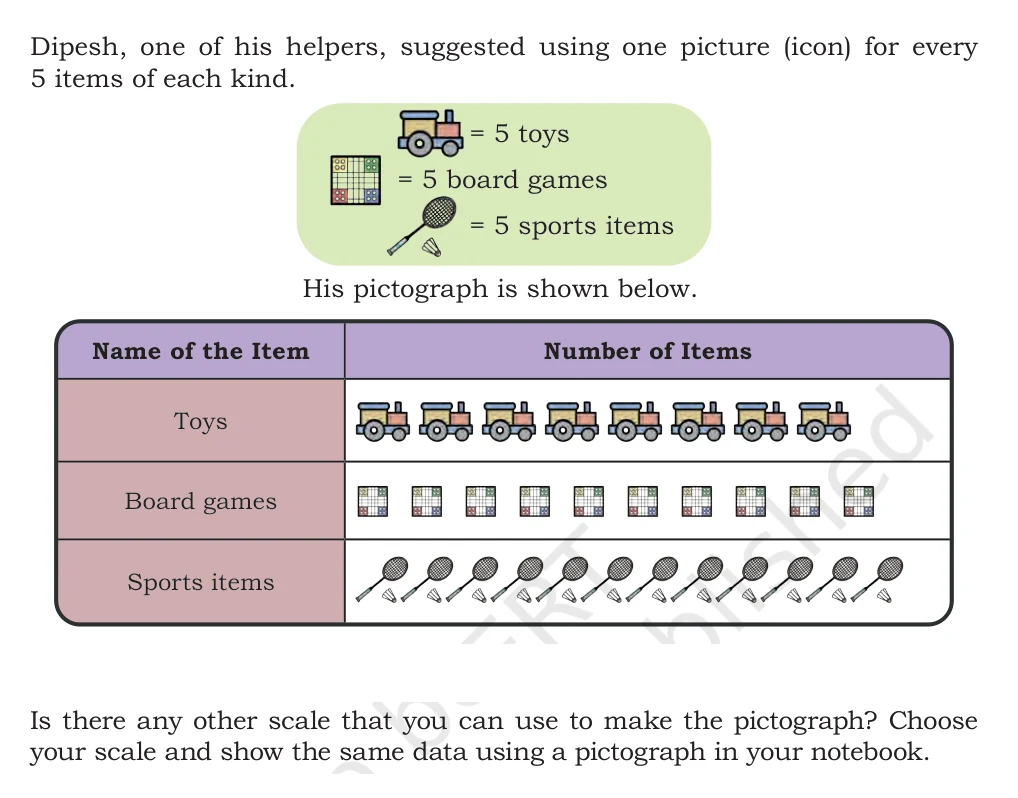
Choose another scale and show the same shop data as a pictograph.
Show detailed solution
- Step 1: Use a scale of one picture for 10 items.
- Step 2: Show 40 toys with 4 pictures and 50 board games with 5 pictures.
- Step 3: Show 60 sports items with 6 pictures and write the scale beside the graph.
- Answer: With one picture representing 10 items, draw 4 toy icons, 5 board-game icons, and 6 sports-item icons.
Detailed worked answers
Textbook page 182
Textbook page 182 · solved item 17
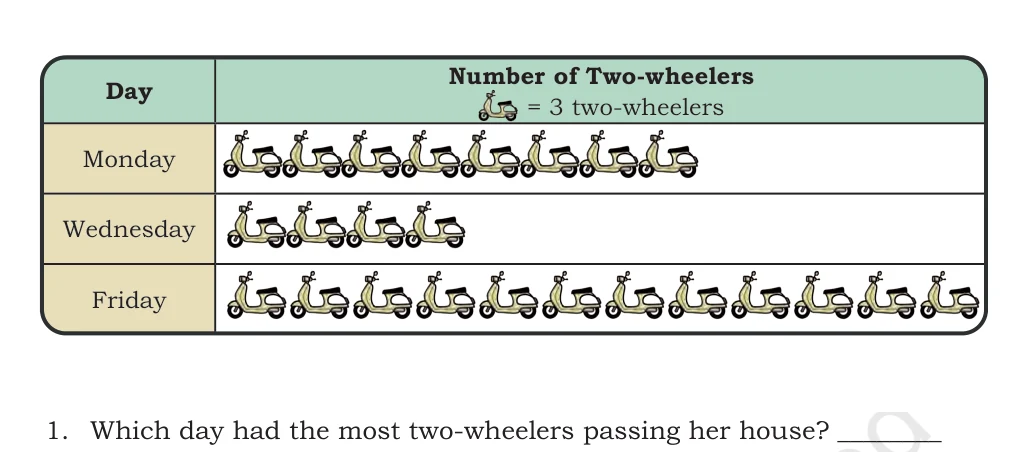
Which day had the most two-wheelers?
Show detailed solution
- Step 1: Count the icons and remember that one icon represents 3 two-wheelers.
- Step 2: Friday has 12 icons, more than Monday's 8 and Wednesday's 4.
- Step 3: Compare the icon counts in all three rows.
- Answer: Friday.
Textbook page 182 · solved item 18
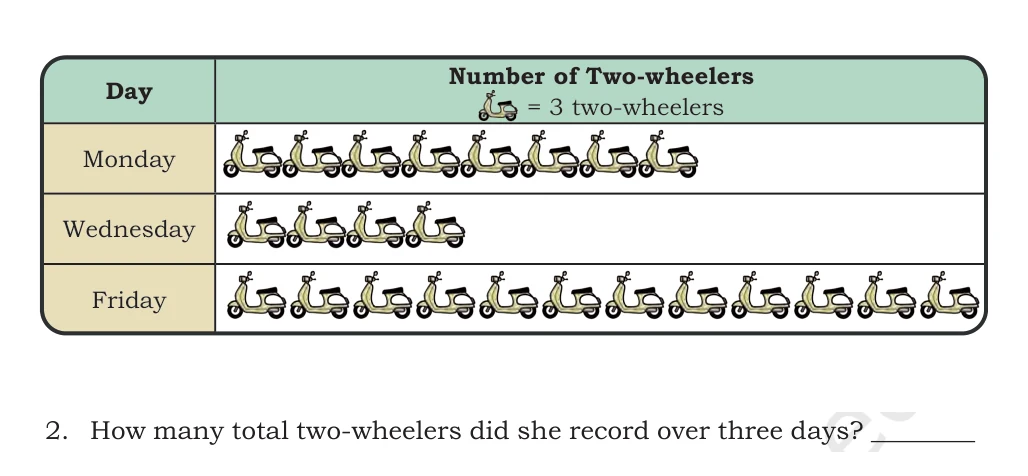
How many two-wheelers were recorded over all three days?
Show detailed solution
- Step 1: Count the icons and remember that one icon represents 3 two-wheelers.
- Step 2: The rows show 8\times3=24, 4\times3=12, and 12\times3=36.
- Step 3: Add them: 24+12+36=72.
- Answer: 72 two-wheelers.
Textbook page 182 · solved item 19
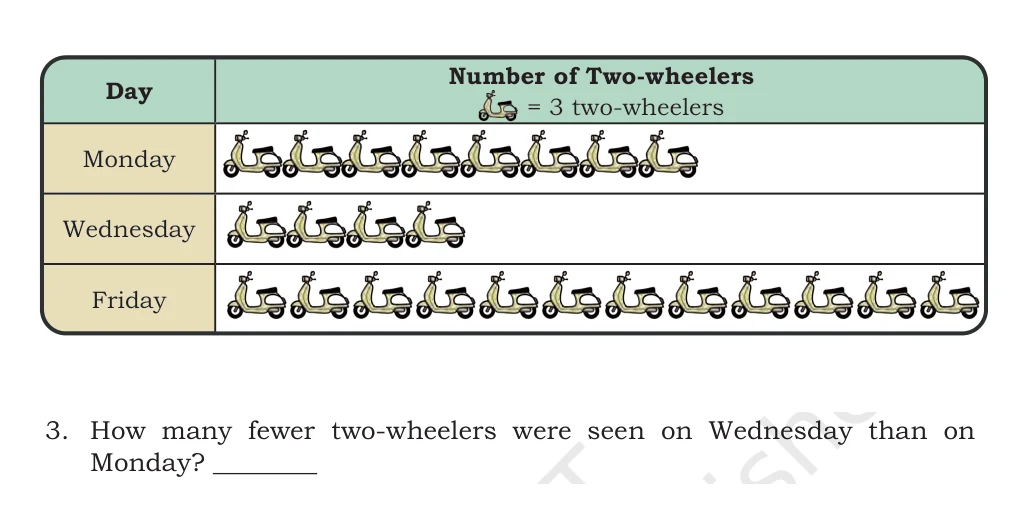
How many fewer two-wheelers were seen on Wednesday than on Monday?
Show detailed solution
- Step 1: Count the icons and remember that one icon represents 3 two-wheelers.
- Step 2: Monday represents 24 and Wednesday represents 12.
- Step 3: Find the difference: 24-12=12.
- Answer: 12 fewer two-wheelers.
Textbook page 182 · solved item 20
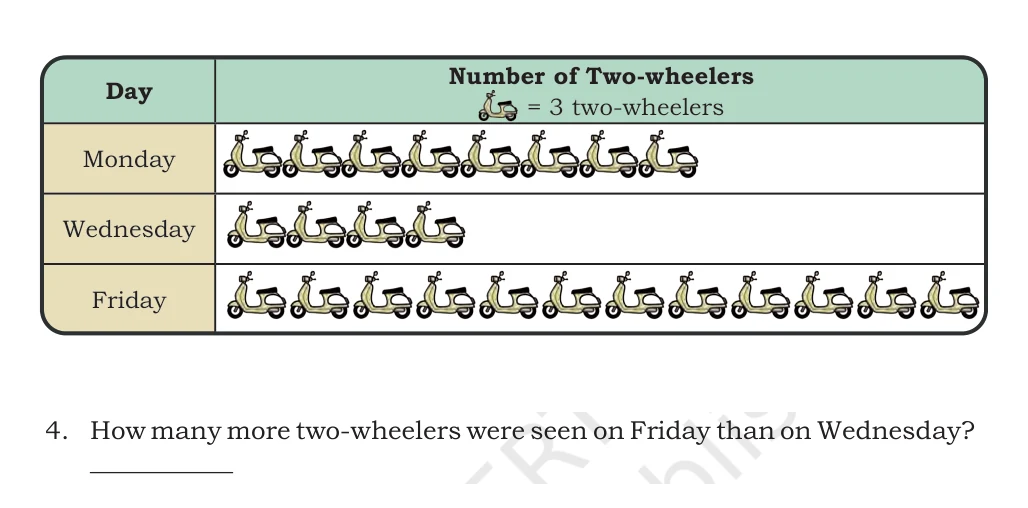
How many more two-wheelers were seen on Friday than on Wednesday?
Show detailed solution
- Step 1: Count the icons and remember that one icon represents 3 two-wheelers.
- Step 2: Friday represents 36 and Wednesday represents 12.
- Step 3: Find the difference: 36-12=24.
- Answer: 24 more two-wheelers.
Textbook page 182 · solved item 21
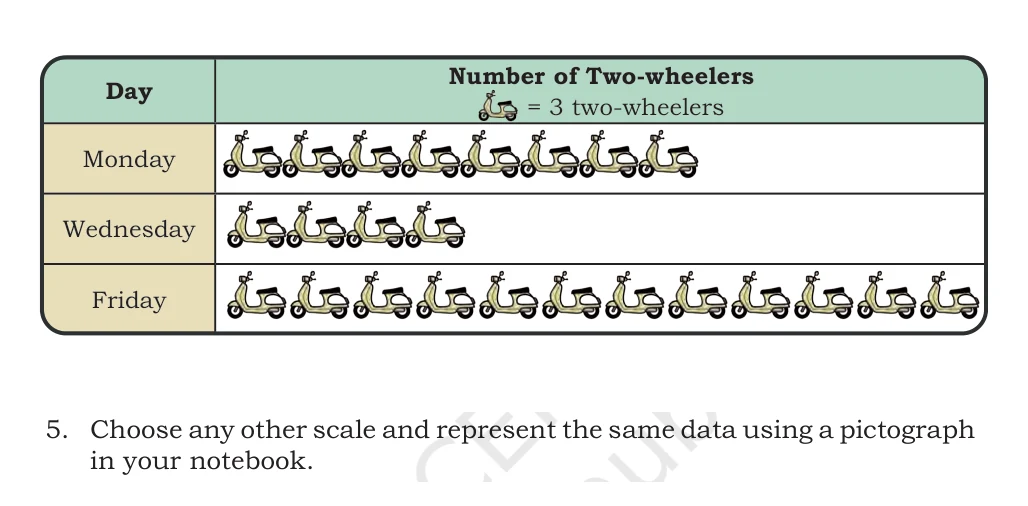
Use another scale to draw the same two-wheeler data.
Show detailed solution
- Step 1: The original totals are 24 on Monday, 12 on Wednesday, and 36 on Friday.
- Step 2: Choose one icon to represent 6 two-wheelers; all three totals divide into groups of 6.
- Step 3: Draw 24\div6=4, 12\div6=2, and 36\div6=6 icons.
- Answer: With one icon representing 6 two-wheelers, draw 4 icons for Monday, 2 for Wednesday, and 6 for Friday.
Detailed worked answers
Textbook page 183
Textbook page 183 · solved item 22
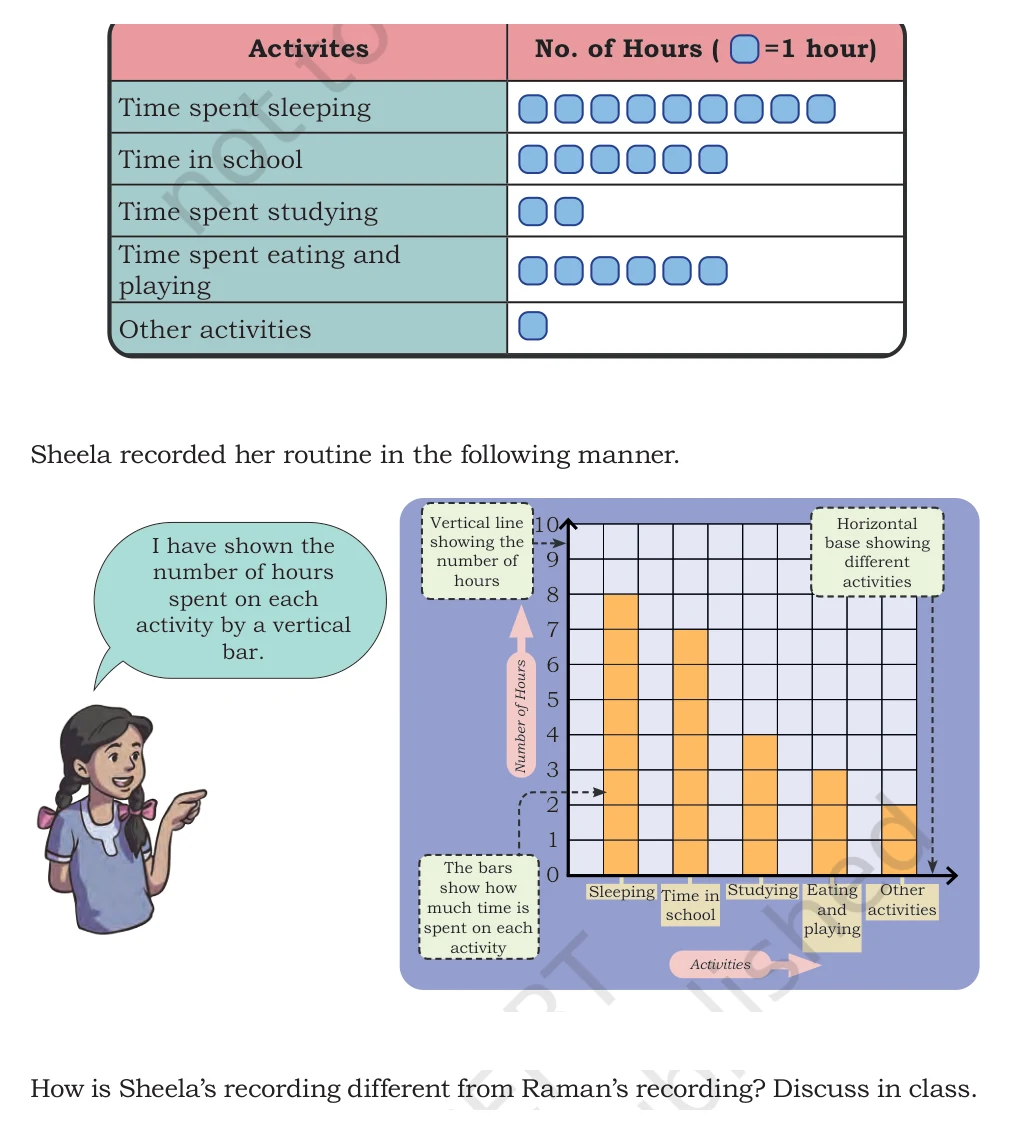
How is Sheela's recording different from Raman's recording?
Show detailed solution
- Step 1: Raman uses one square picture for each hour in a pictograph table.
- Step 2: Sheela places one vertical bar above each activity.
- Step 3: The height of each of Sheela's bars shows the number of hours on the vertical scale.
- Answer: Raman uses a pictograph, while Sheela uses a bar graph.
Textbook page 183 · solved item 23
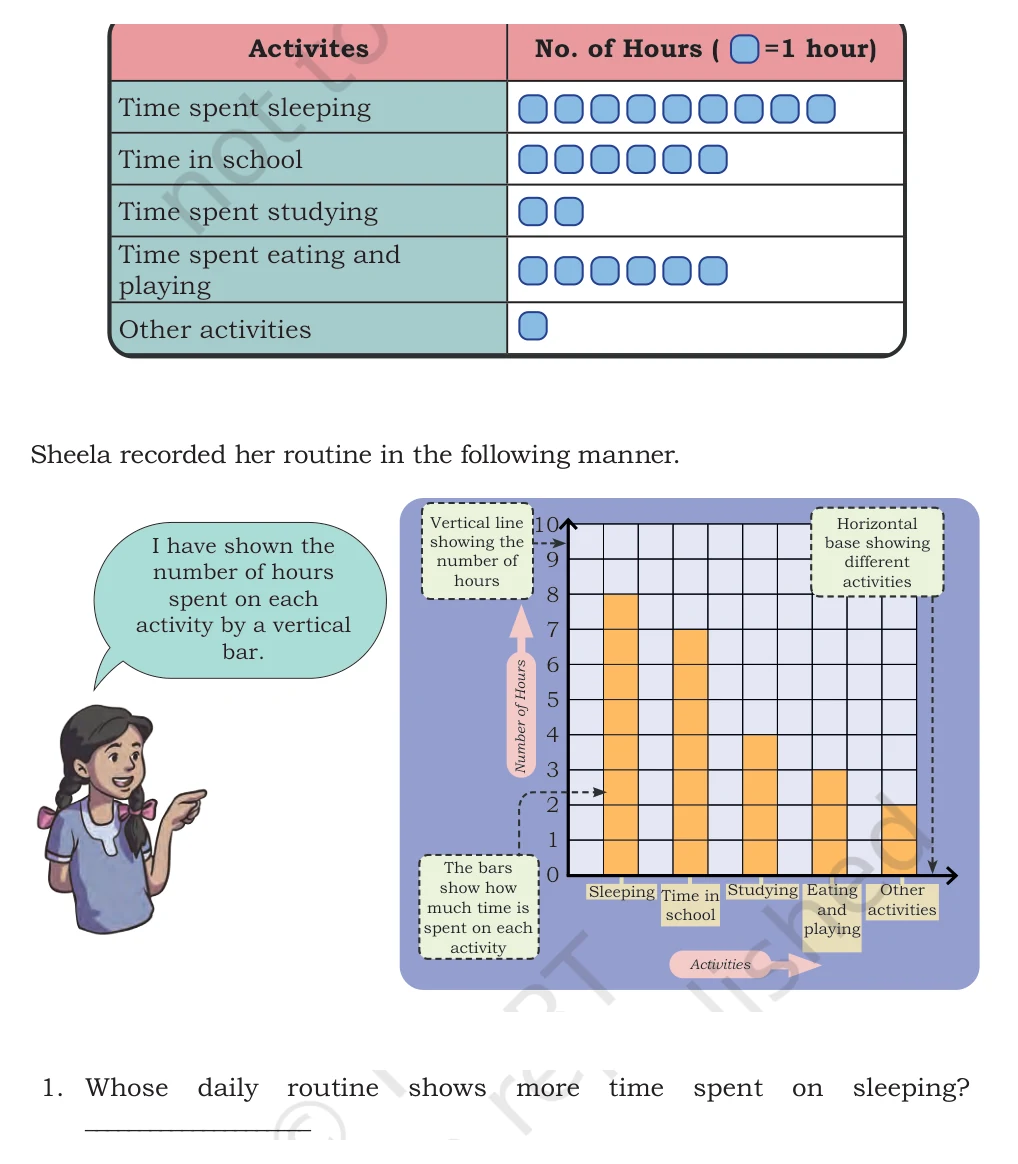
Whose routine shows more time spent sleeping?
Show detailed solution
- Step 1: Raman has 9 sleeping squares and Sheela's sleeping bar reaches 8.
- Step 2: 9 is greater than 8.
- Step 3: Read both displays using their one-hour scale before comparing.
- Answer: Raman.
Textbook page 183 · solved item 24
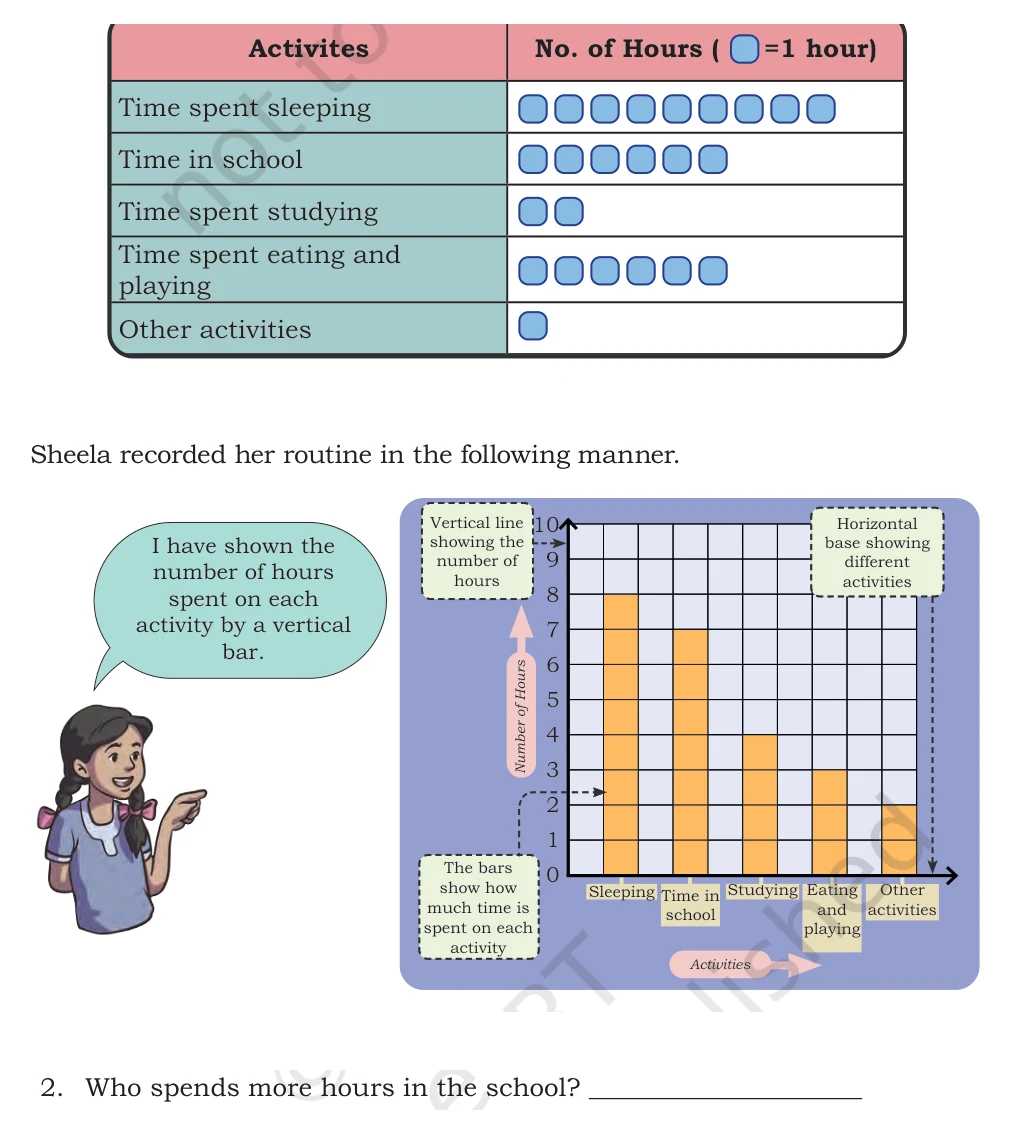
Who spends more hours in school?
Show detailed solution
- Step 1: Raman's row shows 6 hours and Sheela's bar reaches 7.
- Step 2: 7 is one more than 6.
- Step 3: Read both displays using their one-hour scale before comparing.
- Answer: Sheela.
Textbook page 183 · solved item 25
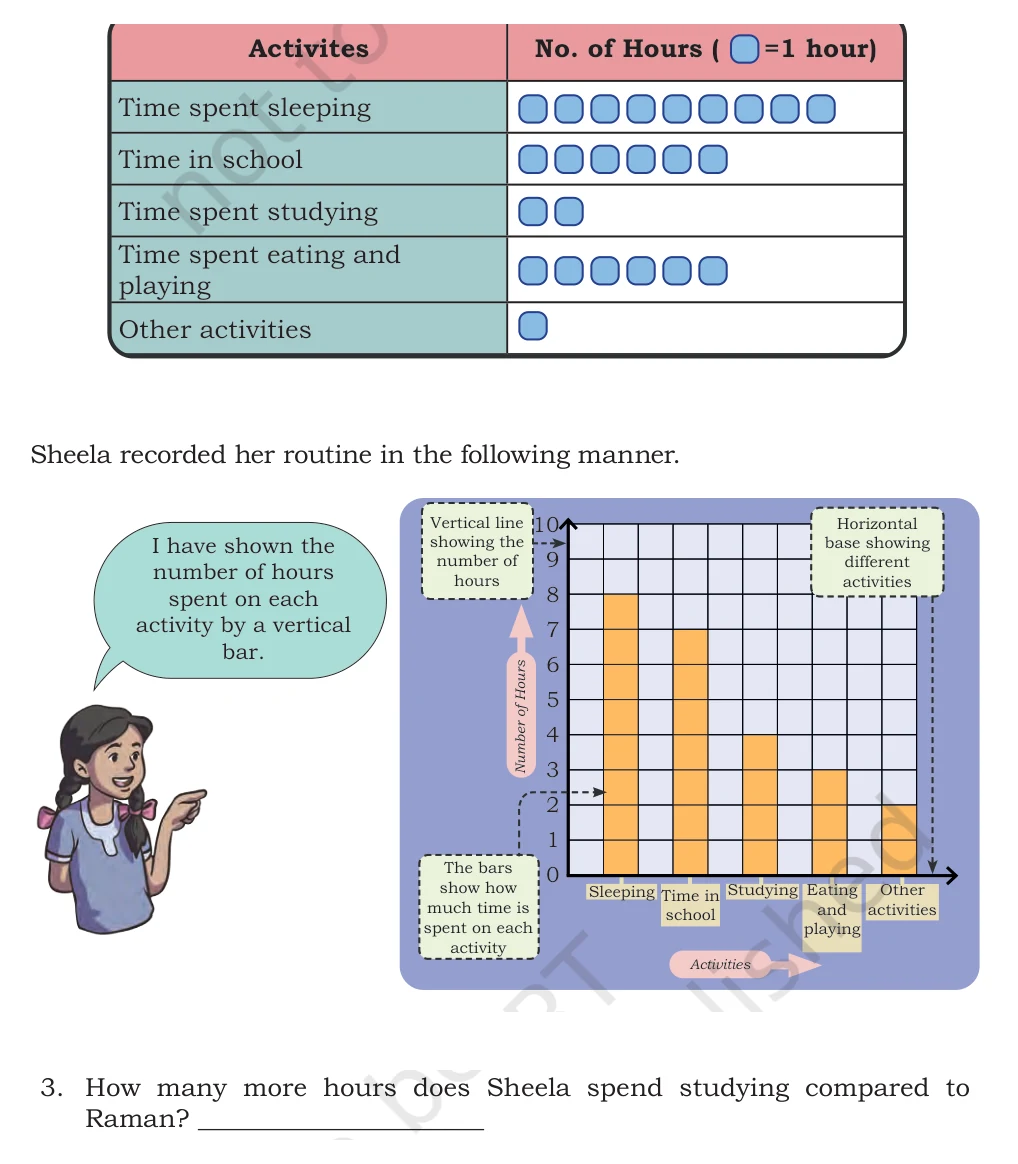
How many more hours does Sheela spend studying than Raman?
Show detailed solution
- Step 1: Sheela's studying bar reaches 4 hours and Raman has 2 studying squares.
- Step 2: Subtract: 4-2=2.
- Step 3: Read both displays using their one-hour scale before comparing.
- Answer: 2 hours more.
Textbook page 183 · solved item 26
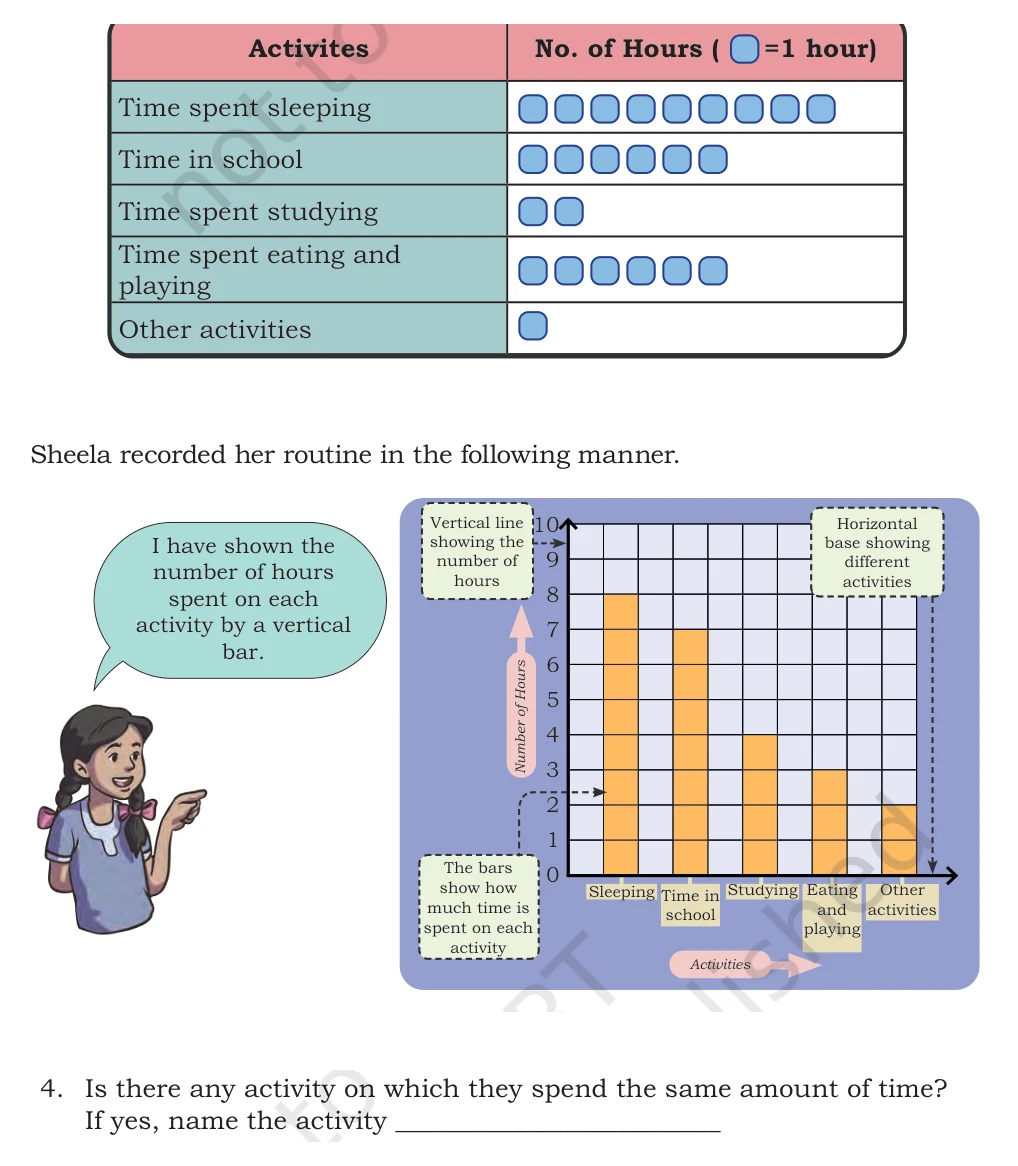
Do Raman and Sheela spend the same amount of time on any activity?
Show detailed solution
- Step 1: Compare matching activities: 9 and 8, 6 and 7, 2 and 4, 6 and 3, 1 and 2.
- Step 2: No matching pair has the same number.
- Step 3: Read both displays using their one-hour scale before comparing.
- Answer: No; none of the five activities has equal time.
Textbook page 183 · solved item 27
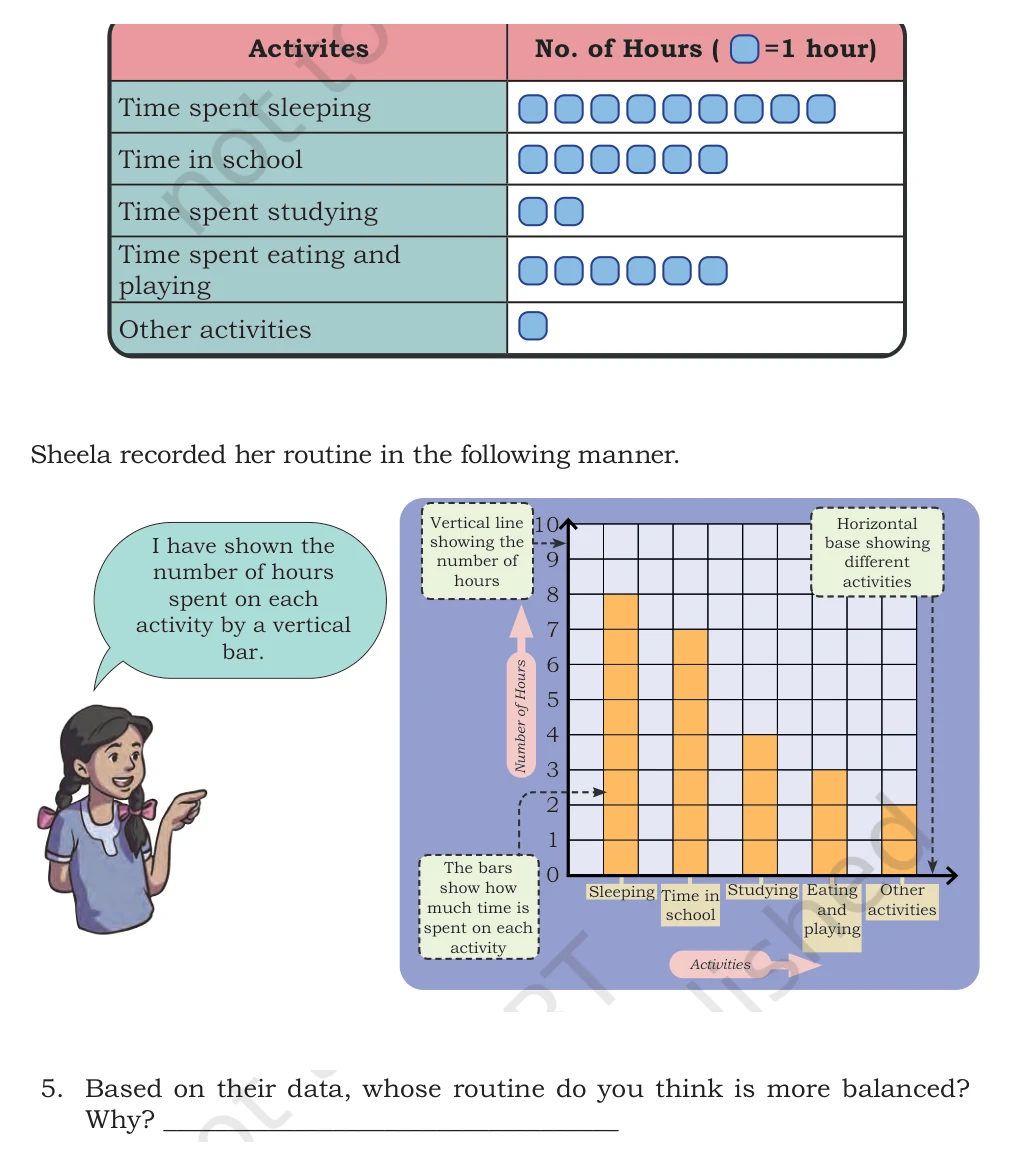
Whose routine appears more balanced, and why?
Show detailed solution
- Step 1: Both routines total 24 hours, so compare how the time is shared.
- Step 2: Sheela has 8 hours of sleep, 7 at school, 4 studying, 3 eating and playing, and 2 for other activities.
- Step 3: Read both displays using their one-hour scale before comparing.
- Answer: Sheela's routine appears more balanced because it gives reasonable time to sleep, school, study, and other needs.
Textbook page 183 · solved item 28

Record a complete 24-hour daily routine.
Show detailed solution
- Step 1: List all major parts of the day: sleeping, school, studying, eating, playing, and other activities.
- Step 2: Use a realistic sample: 9, 7, 2, 2, 2, and 2 hours respectively.
- Step 3: Check the full day: 9+7+2+2+2+2=24 hours.
- Answer: Answers will differ. The sample routine is sleeping 9 hours, school 7, studying 2, eating 2, playing 2, and other activities 2 hours.
Detailed worked answers
Textbook page 184
Textbook page 184 · solved item 29
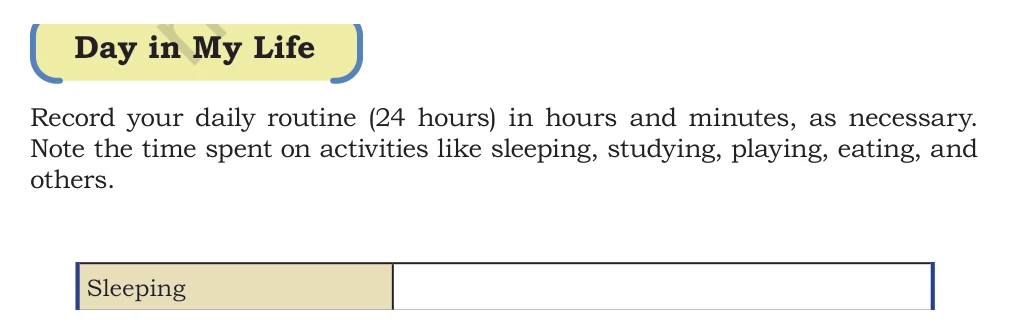
Complete the daily-routine table row for sleeping.
Show detailed solution
- Step 1: Use the sample 24-hour routine and find the time for sleeping.
- Step 2: The sample gives 9 hours to this activity.
- Step 3: After filling every row, add all six entries to check that they make 24 hours.
- Answer: Write 9 hours for sleeping. Answers can differ for your own routine.
Textbook page 184 · solved item 30
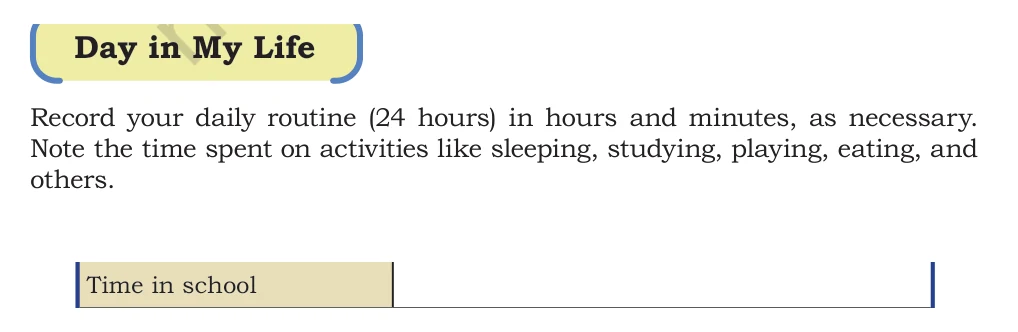
Complete the daily-routine table row for time in school.
Show detailed solution
- Step 1: Use the sample 24-hour routine and find the time for time in school.
- Step 2: The sample gives 7 hours to this activity.
- Step 3: After filling every row, add all six entries to check that they make 24 hours.
- Answer: Write 7 hours for time in school. Answers can differ for your own routine.
Textbook page 184 · solved item 31
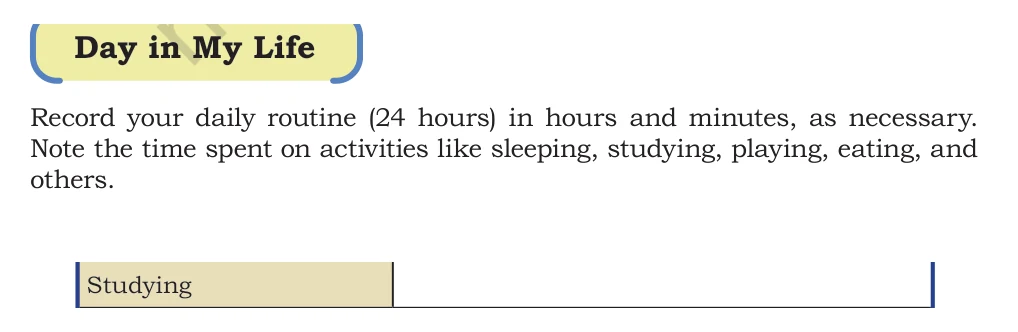
Complete the daily-routine table row for studying.
Show detailed solution
- Step 1: Use the sample 24-hour routine and find the time for studying.
- Step 2: The sample gives 2 hours to this activity.
- Step 3: After filling every row, add all six entries to check that they make 24 hours.
- Answer: Write 2 hours for studying. Answers can differ for your own routine.
Textbook page 184 · solved item 32
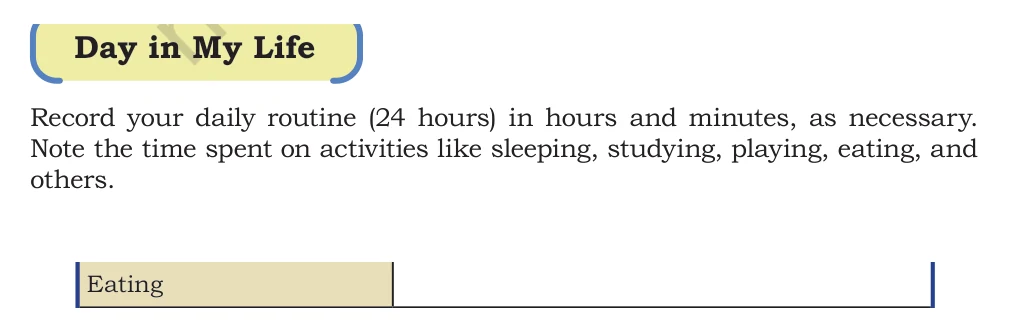
Complete the daily-routine table row for eating.
Show detailed solution
- Step 1: Use the sample 24-hour routine and find the time for eating.
- Step 2: The sample gives 2 hours to this activity.
- Step 3: After filling every row, add all six entries to check that they make 24 hours.
- Answer: Write 2 hours for eating. Answers can differ for your own routine.
Textbook page 184 · solved item 33
Complete the daily-routine table row for playing.
Show detailed solution
- Step 1: Use the sample 24-hour routine and find the time for playing.
- Step 2: The sample gives 2 hours to this activity.
- Step 3: After filling every row, add all six entries to check that they make 24 hours.
- Answer: Write 2 hours for playing. Answers can differ for your own routine.
Textbook page 184 · solved item 34
Complete the daily-routine table row for other activities.
Show detailed solution
- Step 1: Use the sample 24-hour routine and find the time for other activities.
- Step 2: The sample gives 2 hours to this activity.
- Step 3: After filling every row, add all six entries to check that they make 24 hours.
- Answer: Write 2 hours for other activities. Answers can differ for your own routine.
Textbook page 184 · solved item 35
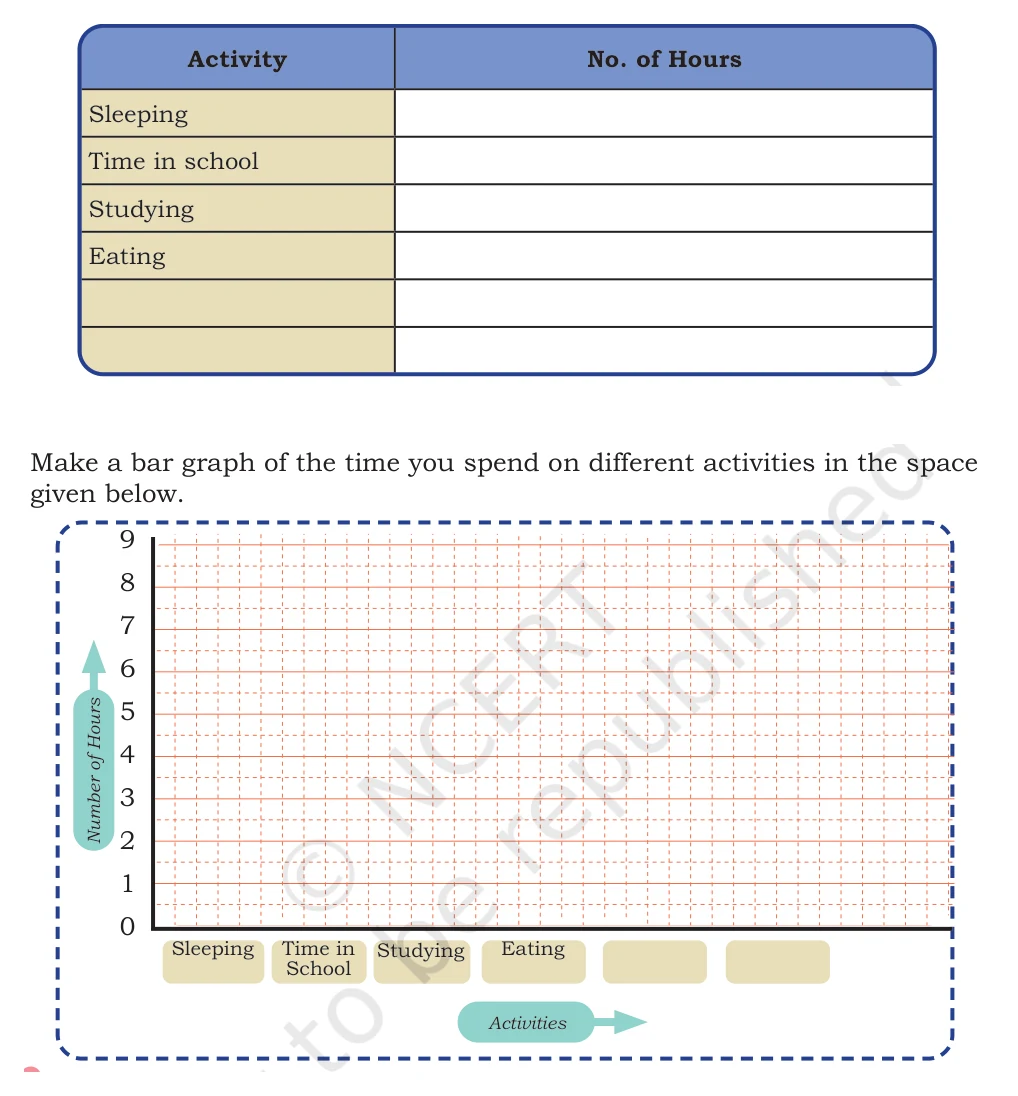
Draw a bar graph for the completed daily-routine table.
Show detailed solution
- Step 1: Write the six activities along the horizontal base and use the vertical scale for hours.
- Step 2: For the sample, draw bars to heights 9, 7, 2, 2, 2, and 2 in the same order as the table.
- Step 3: Give every bar the same width and begin every bar at zero.
- Answer: The sample graph has bars at 9 hours for sleeping, 7 for school, and 2 each for studying, eating, playing, and other activities.
Textbook page 184 · solved item 36
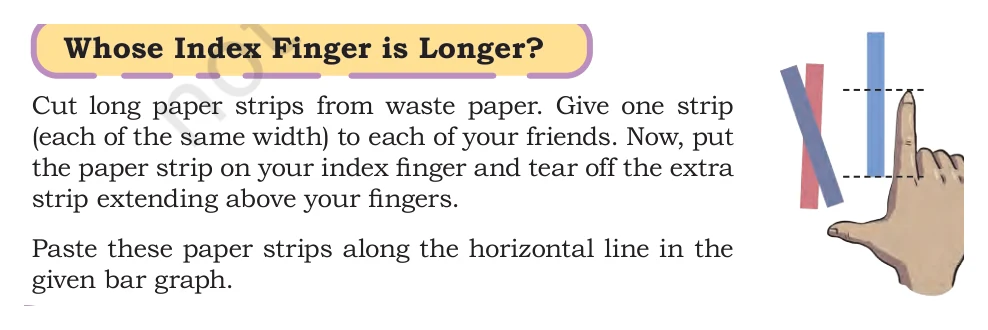
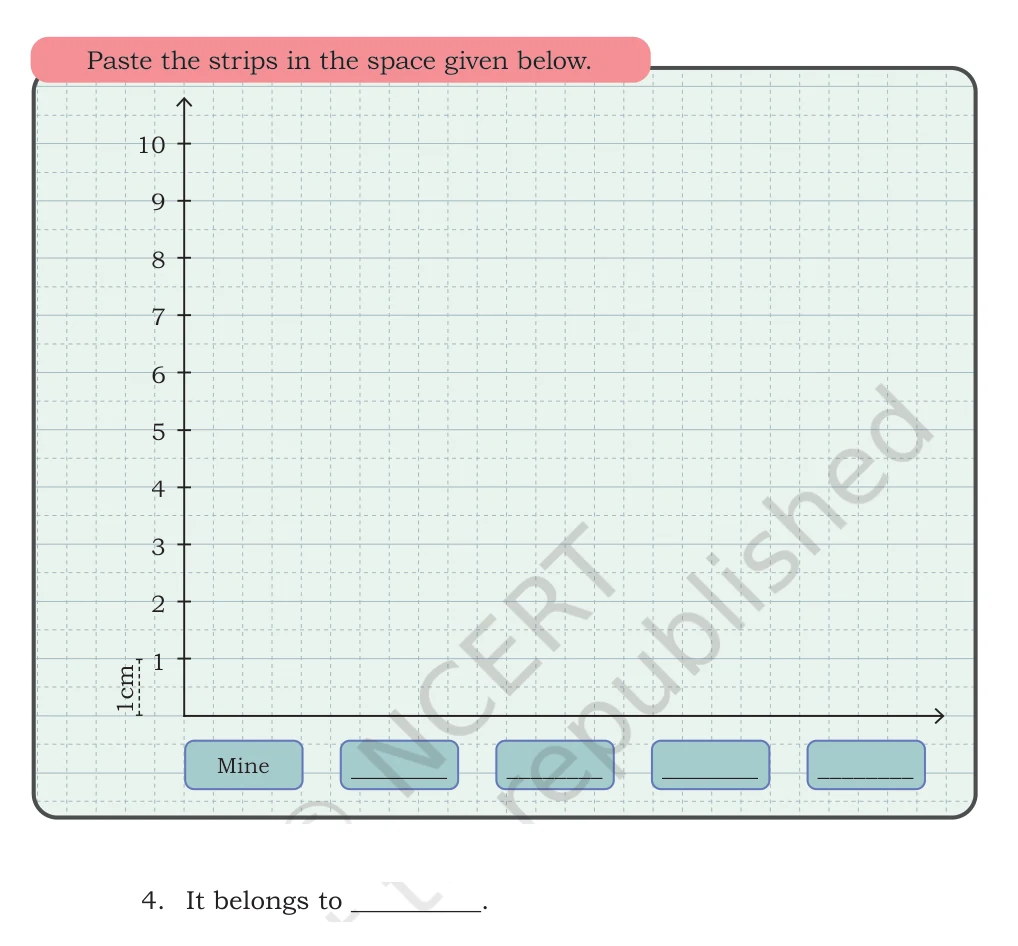
Measure friends' index fingers with equal-width paper strips and prepare a strip graph.
Show detailed solution
- Step 1: Give each person an equal-width strip and tear it to the exact length of the index finger.
- Step 2: Measure each strip in centimetres and write the person's name below it.
- Step 3: Paste every strip from the same horizontal starting line so their lengths can be compared fairly.
- Answer: Results will differ. A sample set is Mine 6 cm, Asha 7 cm, Ravi 6 cm, Noor 5 cm, and Kabir 8 cm.
Detailed worked answers
Textbook page 185
Textbook page 185 · solved item 37
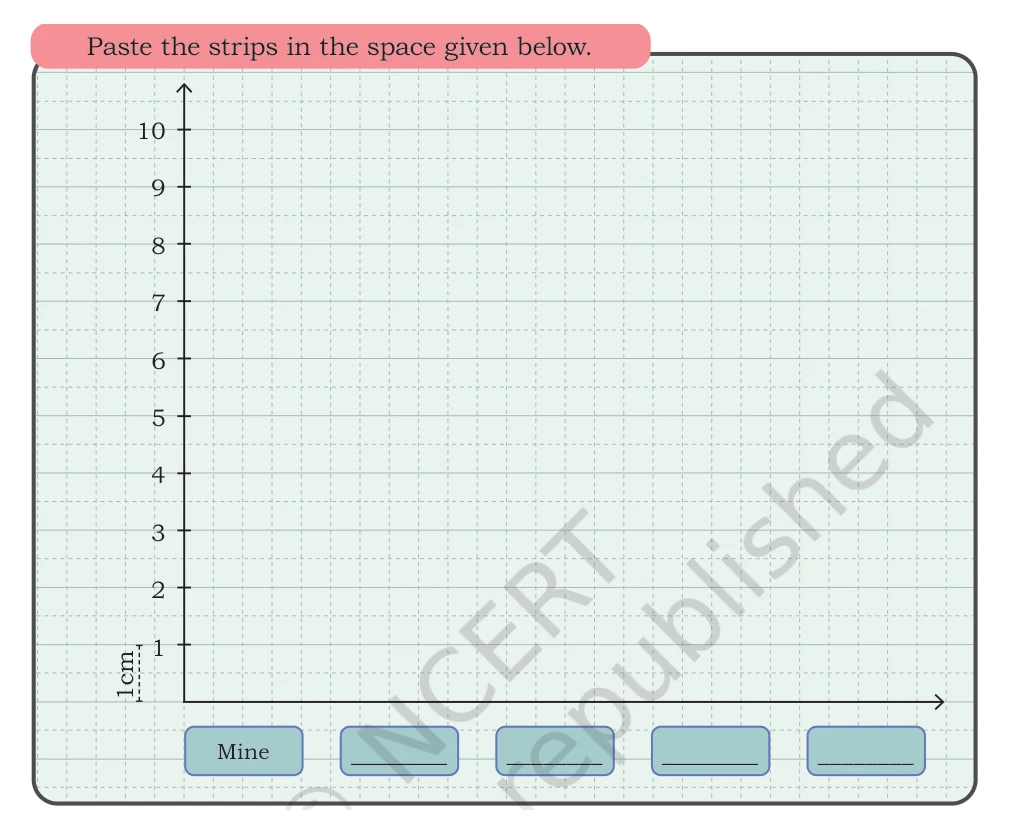
Paste the measured finger strips on the graph.
Show detailed solution
- Step 1: Label the five spaces with Mine and the four friends' names.
- Step 2: Paste each strip above the correct name, beginning at the zero line.
- Step 3: Use the 1 cm scale to check the height of every strip.
- Answer: Answers will differ. For the sample data, the strip heights are 6, 7, 6, 5, and 8 cm.
Textbook page 185 · solved item 38
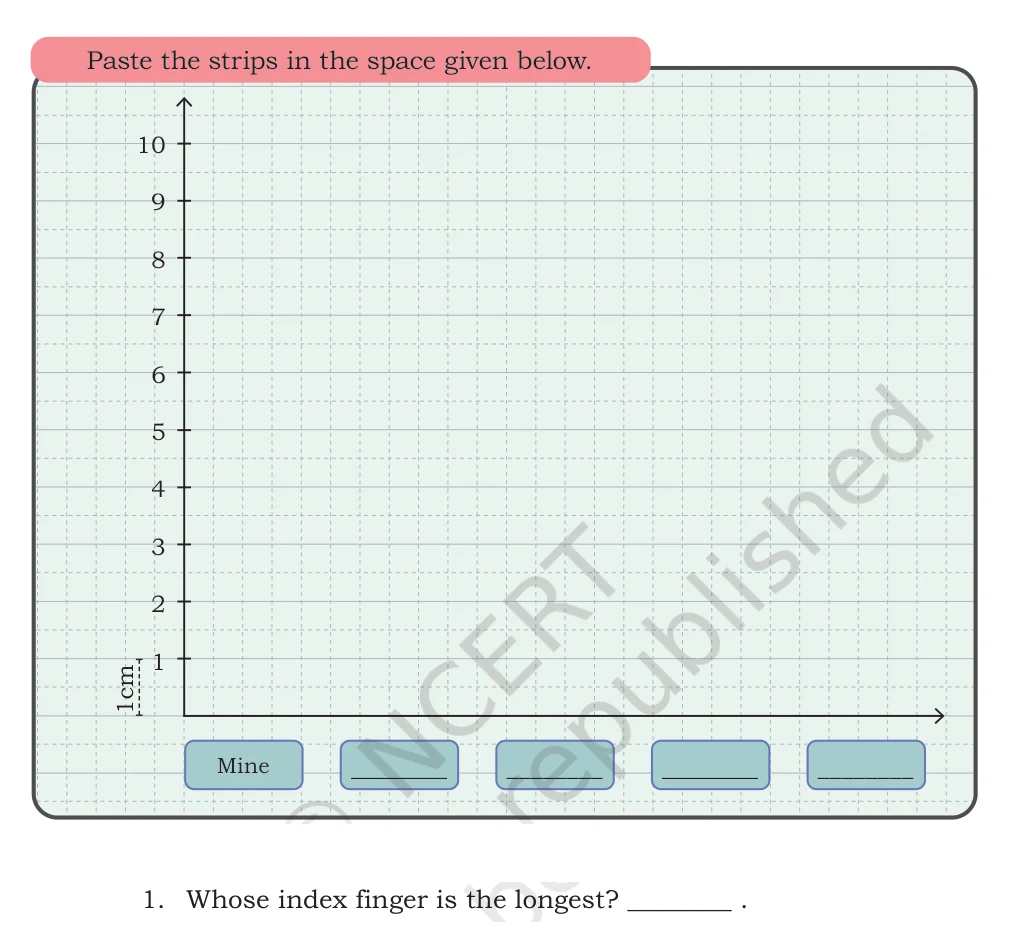
Whose index finger is the longest?
Show detailed solution
- Step 1: Find the tallest strip in the graph.
- Step 2: In the sample, Kabir's strip reaches 8 cm, higher than all others.
- Step 3: Use your own graph instead if your measurements are different.
- Answer: In the sample, Kabir's.
Textbook page 185 · solved item 39
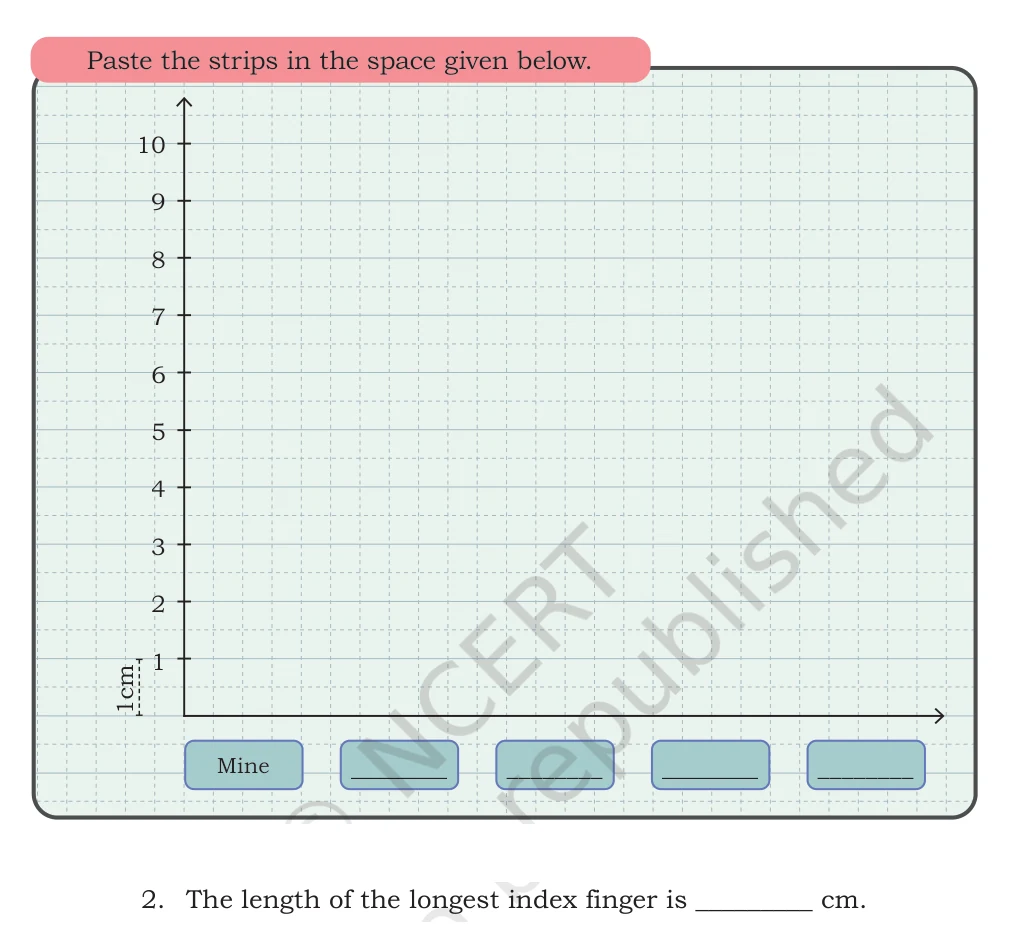
What is the length of the longest index finger?
Show detailed solution
- Step 1: Read the height of the tallest strip against the centimetre scale.
- Step 2: The sample's tallest strip reaches 8.
- Step 3: Use your own graph instead if your measurements are different.
- Answer: In the sample, 8 cm.
Textbook page 185 · solved item 40
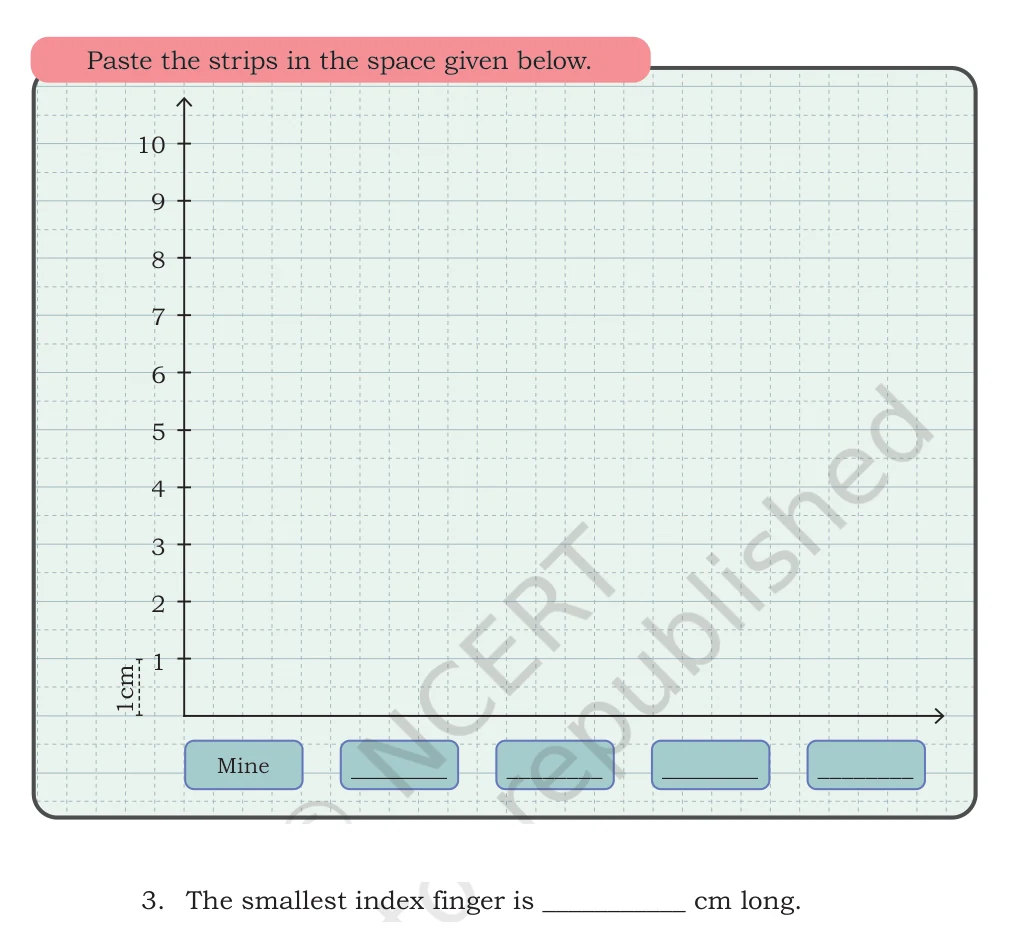
How long is the smallest index finger?
Show detailed solution
- Step 1: Find the shortest strip and read its height.
- Step 2: In the sample, the shortest strip reaches 5.
- Step 3: Use your own graph instead if your measurements are different.
- Answer: In the sample, 5 cm.
Textbook page 185 · solved item 41
Who has the smallest index finger?
Show detailed solution
- Step 1: Match the shortest strip to the name beneath it.
- Step 2: The 5 cm sample strip belongs to Noor.
- Step 3: Use your own graph instead if your measurements are different.
- Answer: In the sample, Noor.
Detailed worked answers
Textbook page 186
Textbook page 186 · solved item 42
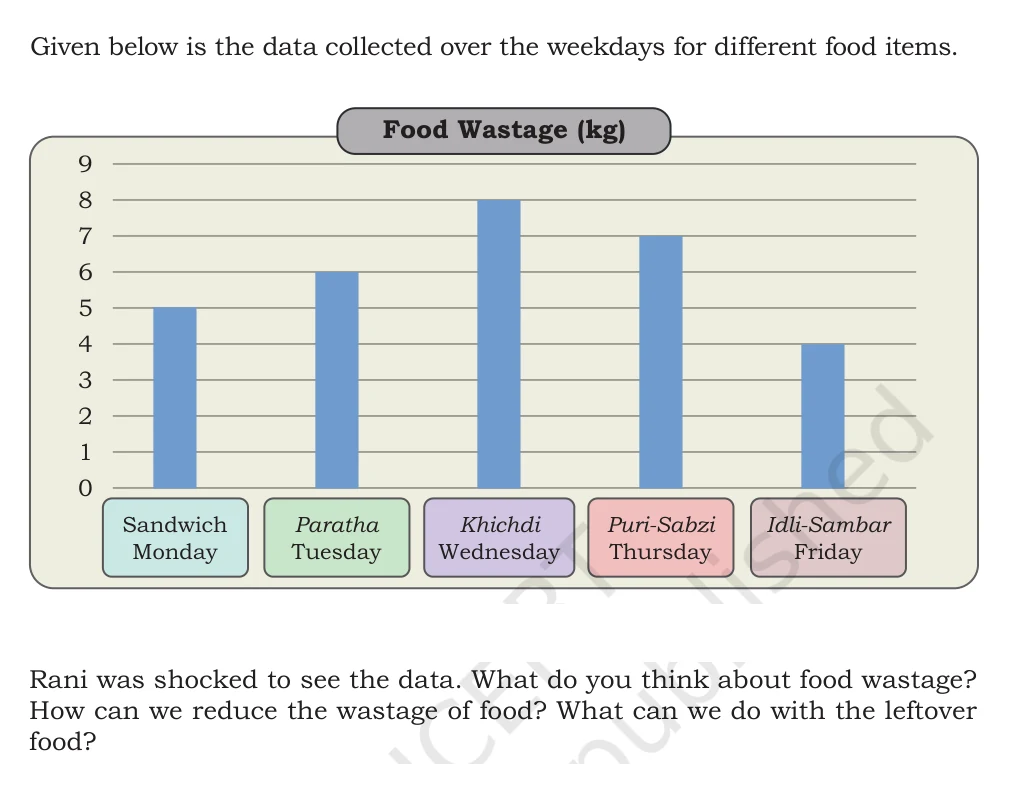
What do you think about food wastage?
Show detailed solution
- Step 1: Food takes water, land, energy, money, and people's work to produce.
- Step 2: Throwing away edible food wastes all those resources.
- Step 3: Choose actions that keep food safe and avoid creating more waste.
- Answer: Food wastage should be reduced because food and the resources used to make it are valuable.
Textbook page 186 · solved item 43
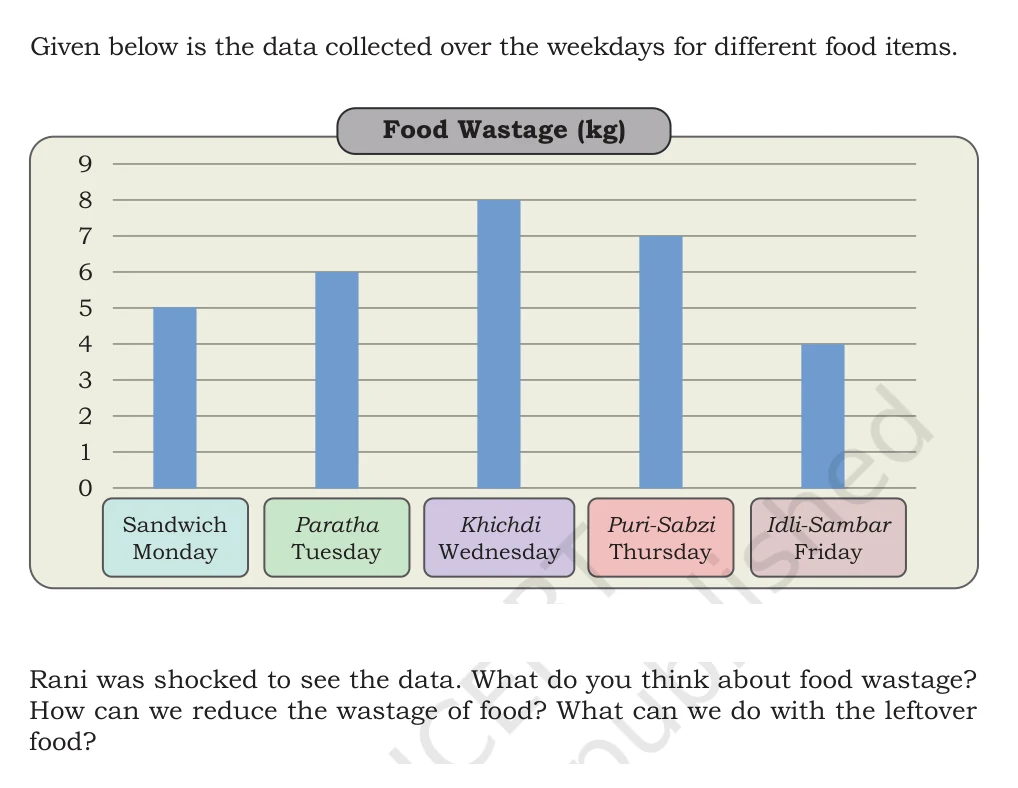
How can we reduce food wastage?
Show detailed solution
- Step 1: Take only as much food as you expect to eat.
- Step 2: Serve a small amount first and take more only if needed.
- Step 3: Choose actions that keep food safe and avoid creating more waste.
- Answer: Plan portions, store food properly, and share extra edible food instead of wasting it.
Textbook page 186 · solved item 44
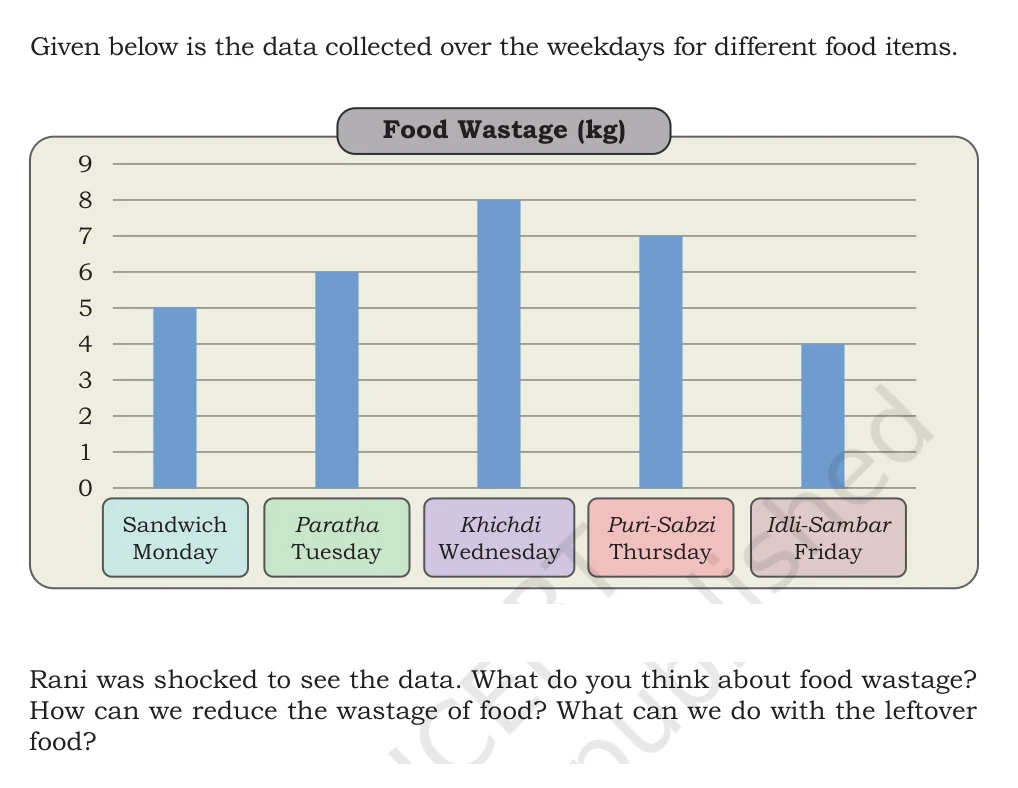
What can we do with leftover food?
Show detailed solution
- Step 1: First check that the food is still safe to eat.
- Step 2: Store it correctly, reuse it in another meal, or share untouched surplus food through a responsible adult.
- Step 3: Choose actions that keep food safe and avoid creating more waste.
- Answer: Safe leftovers can be stored, reused, or shared; inedible scraps can be composted where suitable.
Textbook page 186 · solved item 45
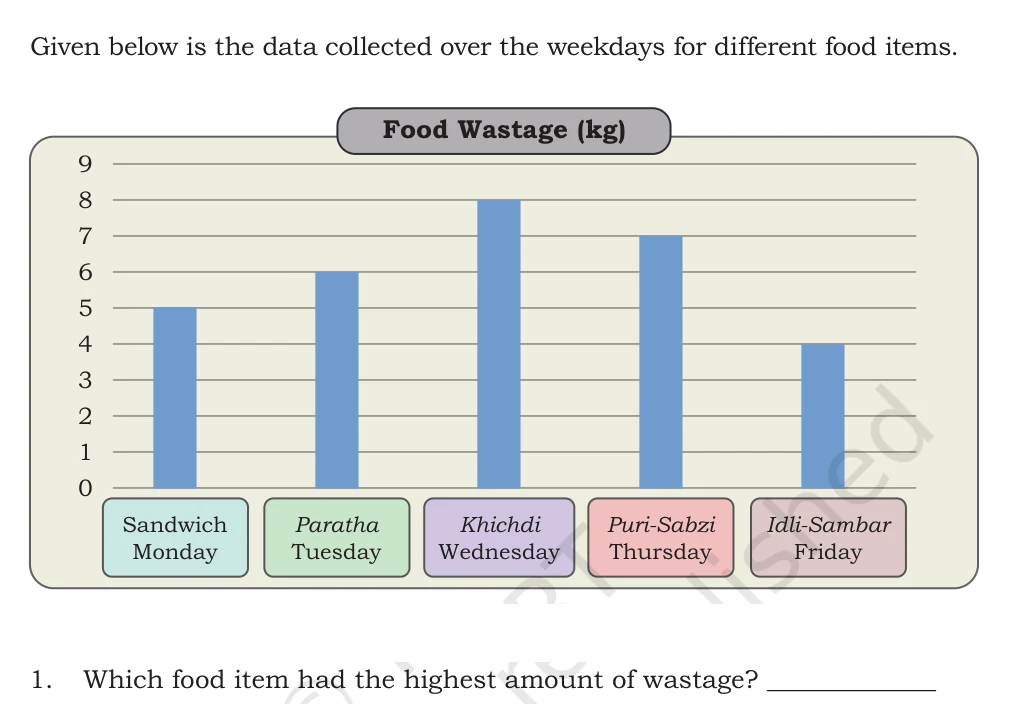
Which food item had the highest wastage?
Show detailed solution
- Step 1: The tallest bar is Khichdi on Wednesday.
- Step 2: It reaches 8 kg.
- Step 3: Check the value against the vertical kilogram scale.
- Answer: Khichdi, with 8 kg.
Textbook page 186 · solved item 46
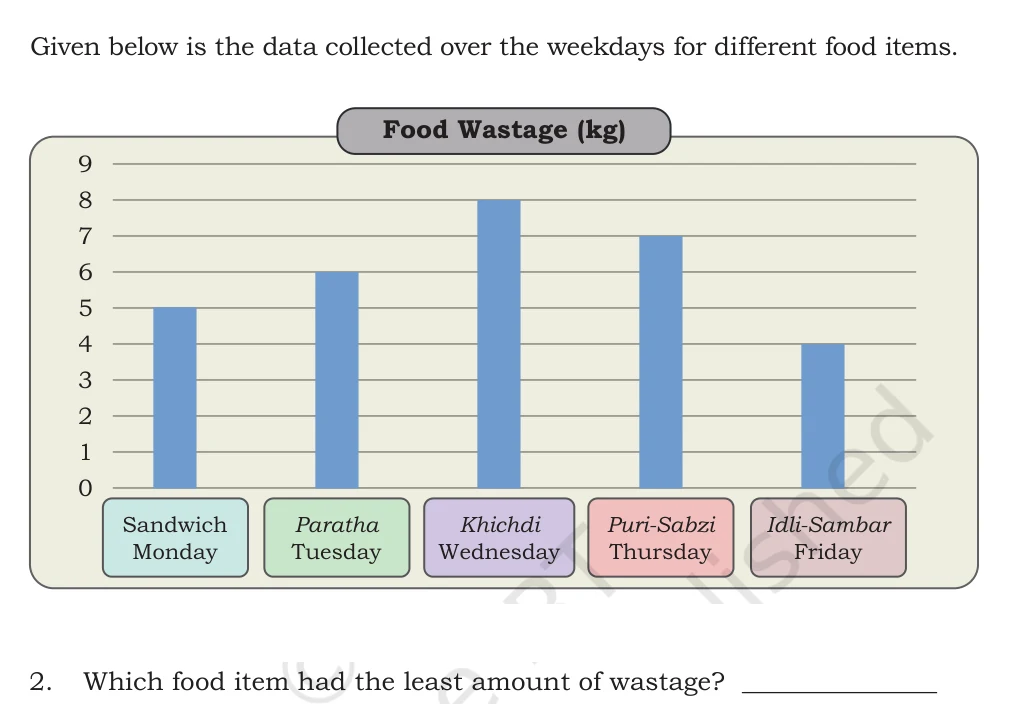
Which food item had the least wastage?
Show detailed solution
- Step 1: The shortest bar is Idli-Sambar on Friday.
- Step 2: It reaches 4 kg.
- Step 3: Check the value against the vertical kilogram scale.
- Answer: Idli-Sambar, with 4 kg.
Textbook page 186 · solved item 47
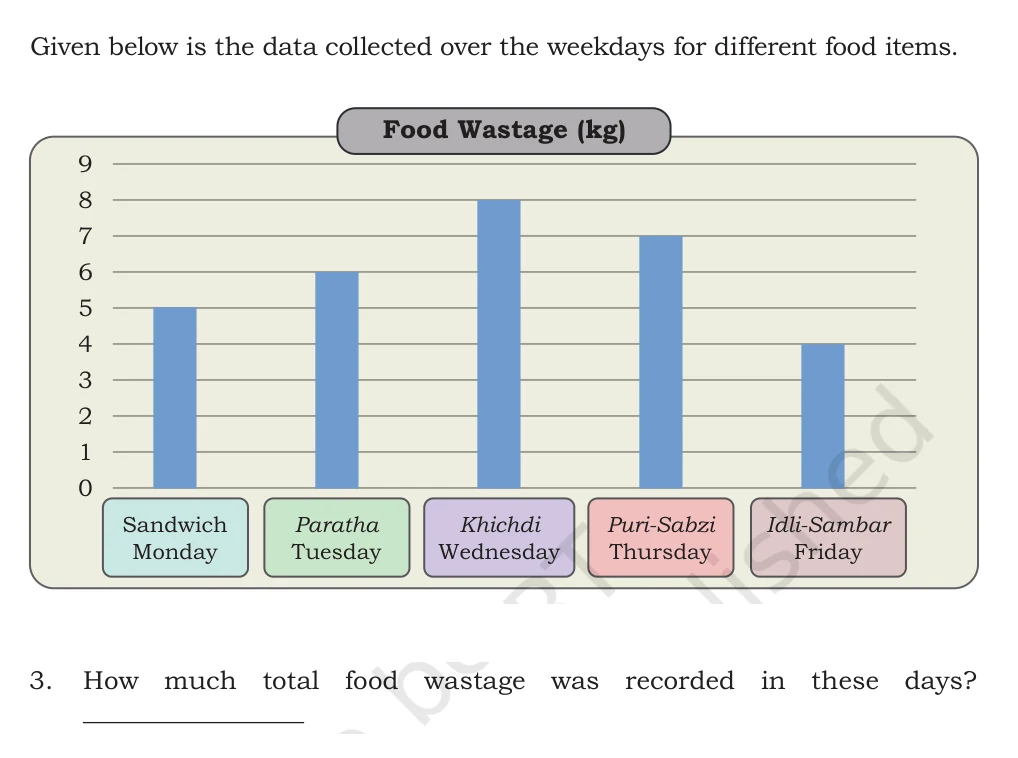
How much food was wasted over all five days?
Show detailed solution
- Step 1: Read the bars as 5, 6, 8, 7, and 4 kg.
- Step 2: Add them: 5+6+8+7+4=30.
- Step 3: Check the value against the vertical kilogram scale.
- Answer: 30 kg.
Textbook page 186 · solved item 48
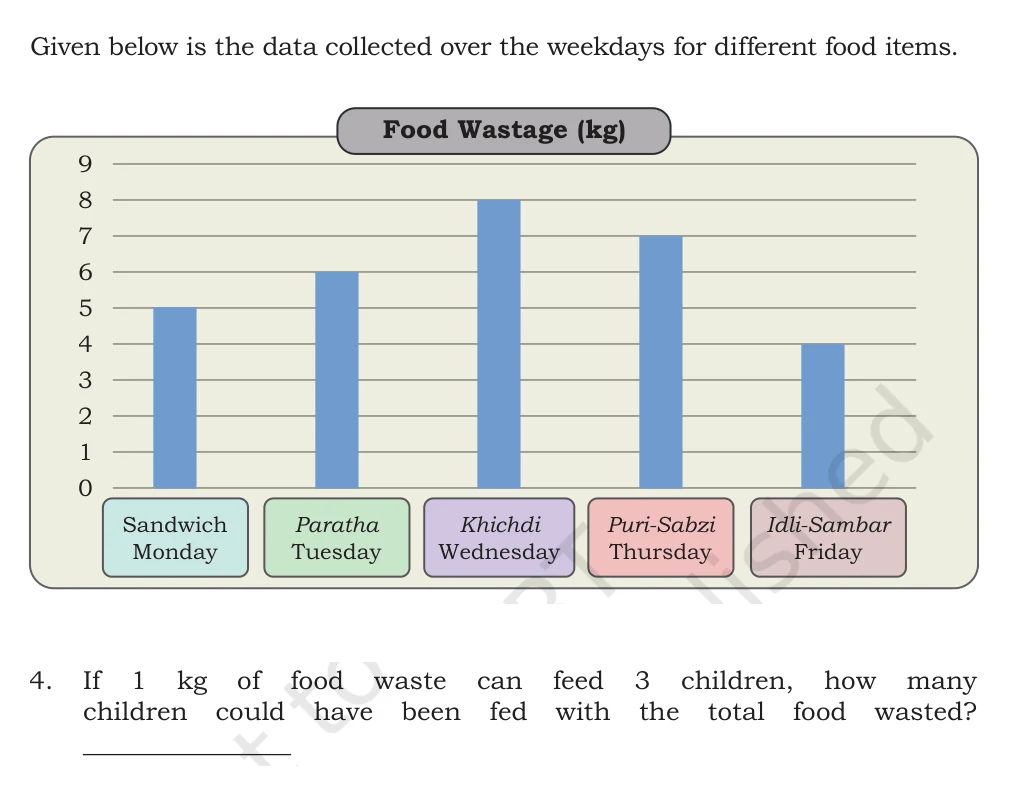
How many children could the total wasted food have fed?
Show detailed solution
- Step 1: The total waste is 30 kg and each kilogram could feed 3 children.
- Step 2: Multiply: 30\times3=90.
- Step 3: Check the value against the vertical kilogram scale.
- Answer: 90 children.
Textbook page 186 · solved item 49
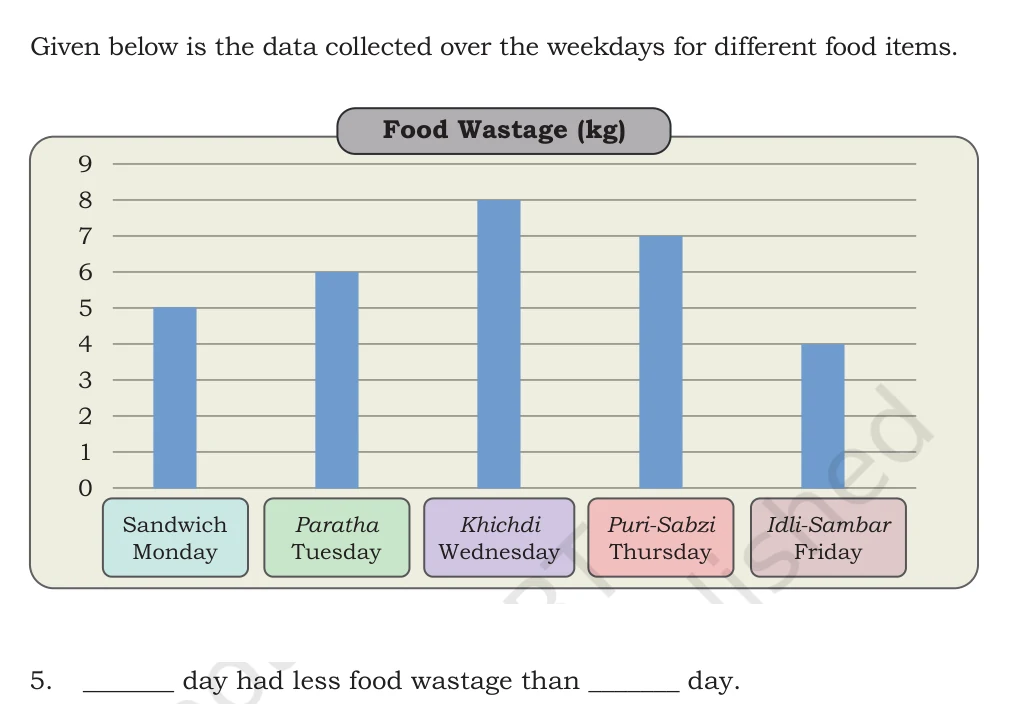
Complete one correct comparison: ___ day had less food wastage than ___ day.
Show detailed solution
- Step 1: Friday has 4 kg and Monday has 5 kg.
- Step 2: Since 4 is less than 5, this pair makes a correct sentence.
- Step 3: Check the value against the vertical kilogram scale.
- Answer: Friday had less food wastage than Monday.
Textbook page 186 · solved item 50
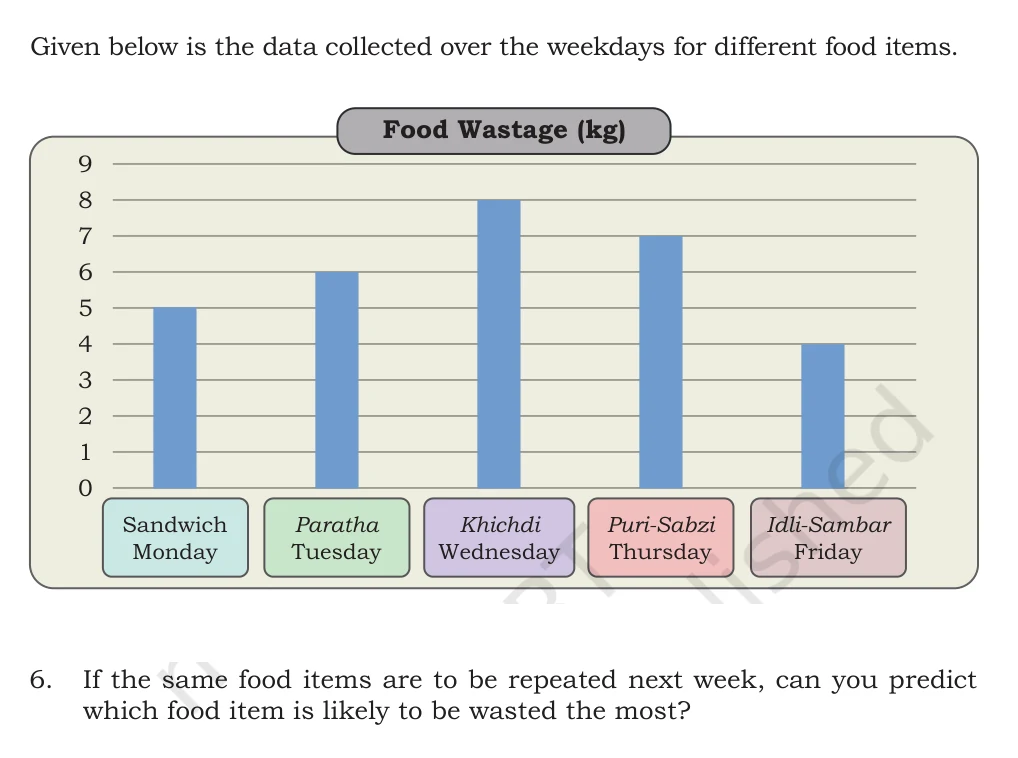
Which food item is likely to be wasted most if the menu repeats next week?
Show detailed solution
- Step 1: Use the given week as a clue, while remembering that a prediction is not certain.
- Step 2: Khichdi has the tallest bar at 8 kg.
- Step 3: Check the value against the vertical kilogram scale.
- Answer: Khichdi is the most likely prediction.
Detailed worked answers
Textbook page 187
Textbook page 187 · solved item 51
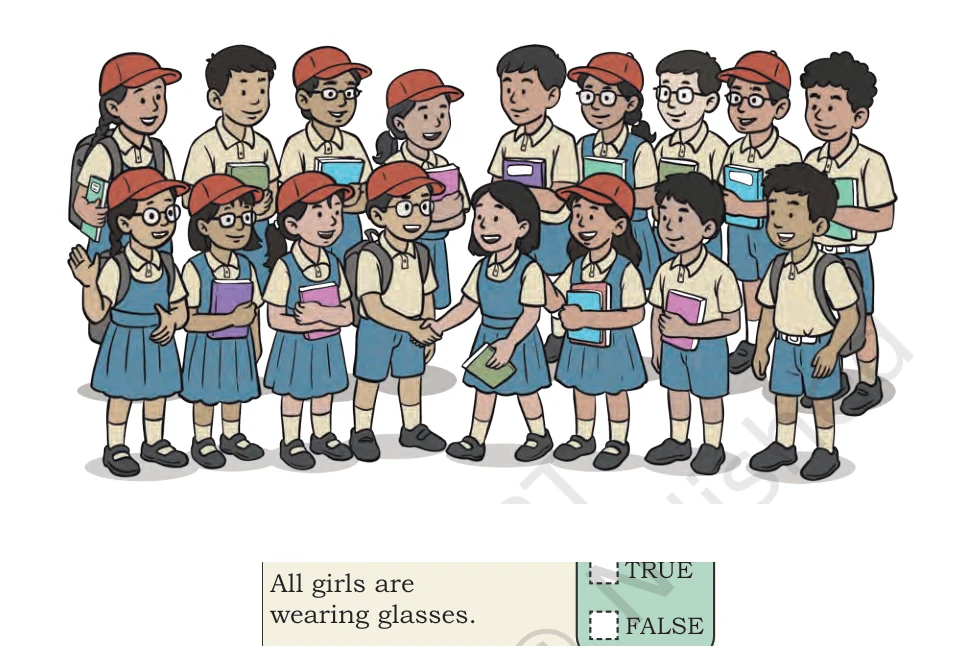
All girls are wearing glasses.
Show detailed solution
- Step 1: Check every child in the picture, not only the first row.
- Step 2: Some girls in the picture do not have glasses.
- Step 3: Compare the observation with the exact words all, more, some, or no in the statement.
- Answer: False.
Textbook page 187 · solved item 52
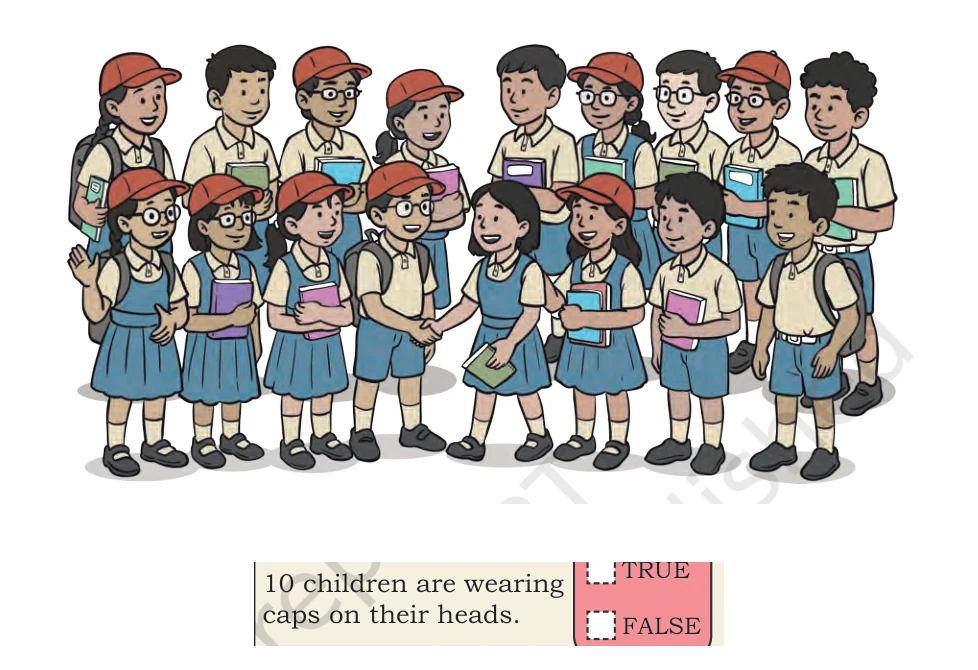
Ten children are wearing caps.
Show detailed solution
- Step 1: Check every child in the picture, not only the first row.
- Step 2: Count 5 caps in the back row and 5 in the front row.
- Step 3: Compare the observation with the exact words all, more, some, or no in the statement.
- Answer: True.
Textbook page 187 · solved item 53
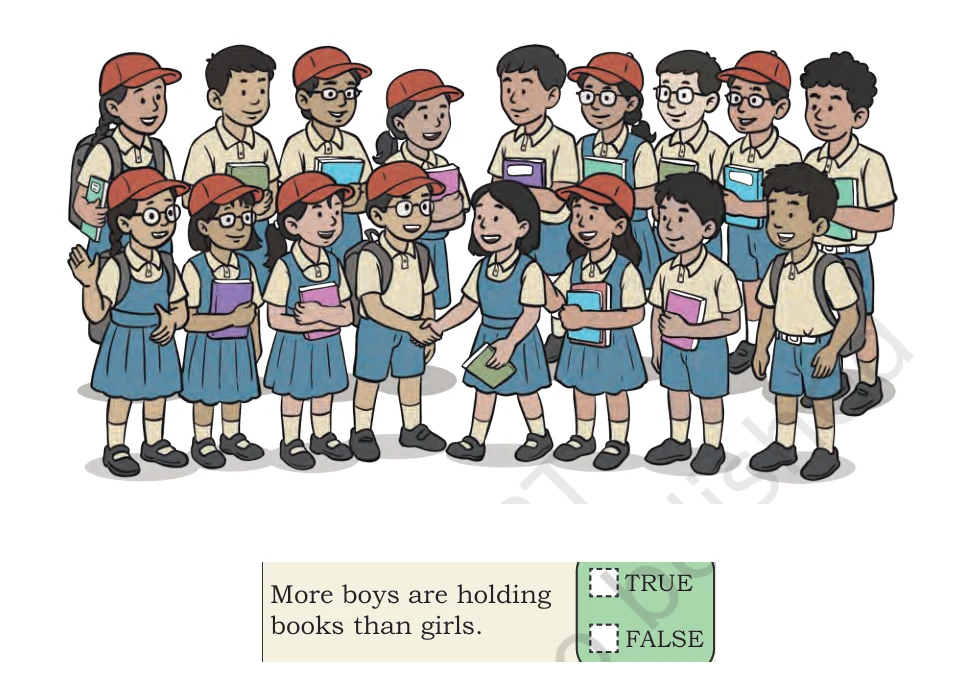
More boys are holding books than girls.
Show detailed solution
- Step 1: Check every child in the picture, not only the first row.
- Step 2: Count the books held by boys and girls; more girls are holding books.
- Step 3: Compare the observation with the exact words all, more, some, or no in the statement.
- Answer: False.
Textbook page 187 · solved item 54
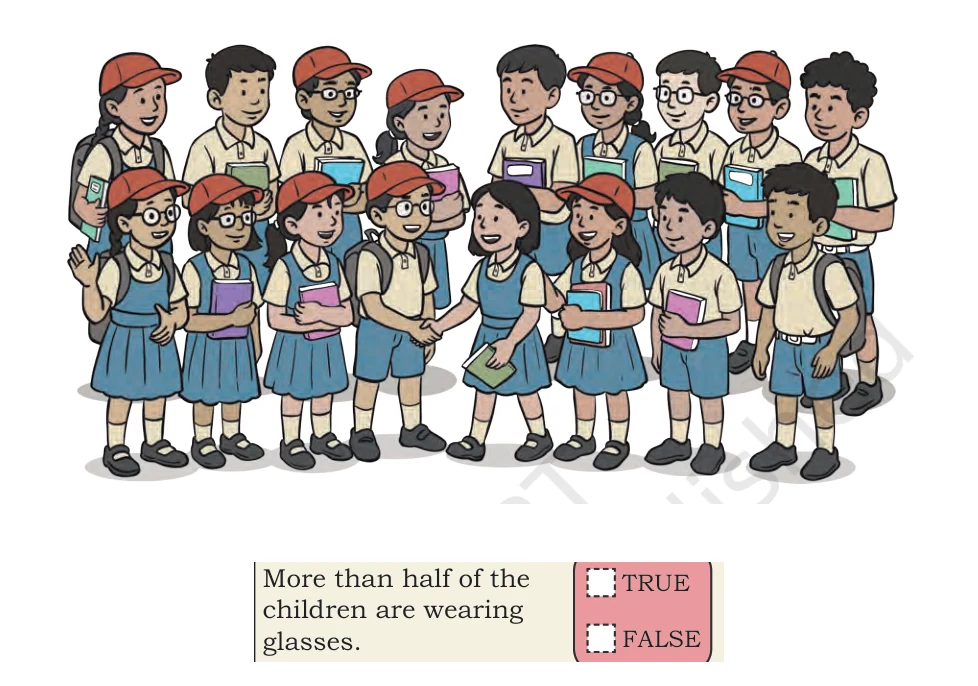
More than half of the children are wearing glasses.
Show detailed solution
- Step 1: Check every child in the picture, not only the first row.
- Step 2: There are 17 children, so more than half would mean at least 9; only 7 wear glasses.
- Step 3: Compare the observation with the exact words all, more, some, or no in the statement.
- Answer: False.
Textbook page 187 · solved item 55
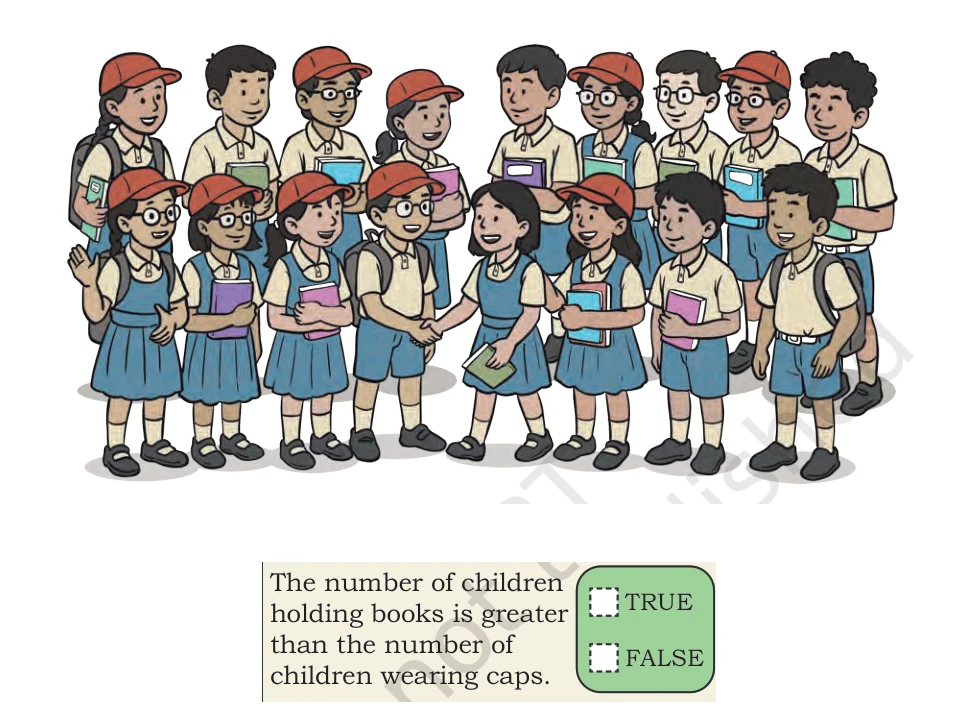
More children are holding books than wearing caps.
Show detailed solution
- Step 1: Check every child in the picture, not only the first row.
- Step 2: The picture shows more book-holders than the 10 cap-wearers.
- Step 3: Compare the observation with the exact words all, more, some, or no in the statement.
- Answer: True.
Textbook page 187 · solved item 56
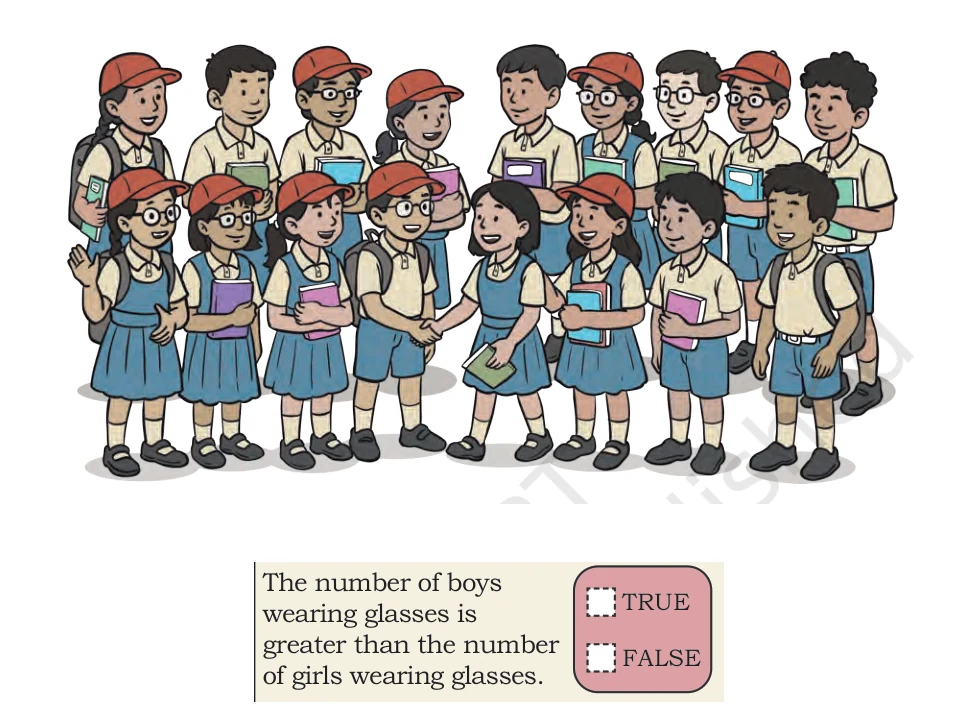
More boys than girls are wearing glasses.
Show detailed solution
- Step 1: Check every child in the picture, not only the first row.
- Step 2: There are 3 boys with glasses and 4 girls with glasses.
- Step 3: Compare the observation with the exact words all, more, some, or no in the statement.
- Answer: False.
Textbook page 187 · solved item 57
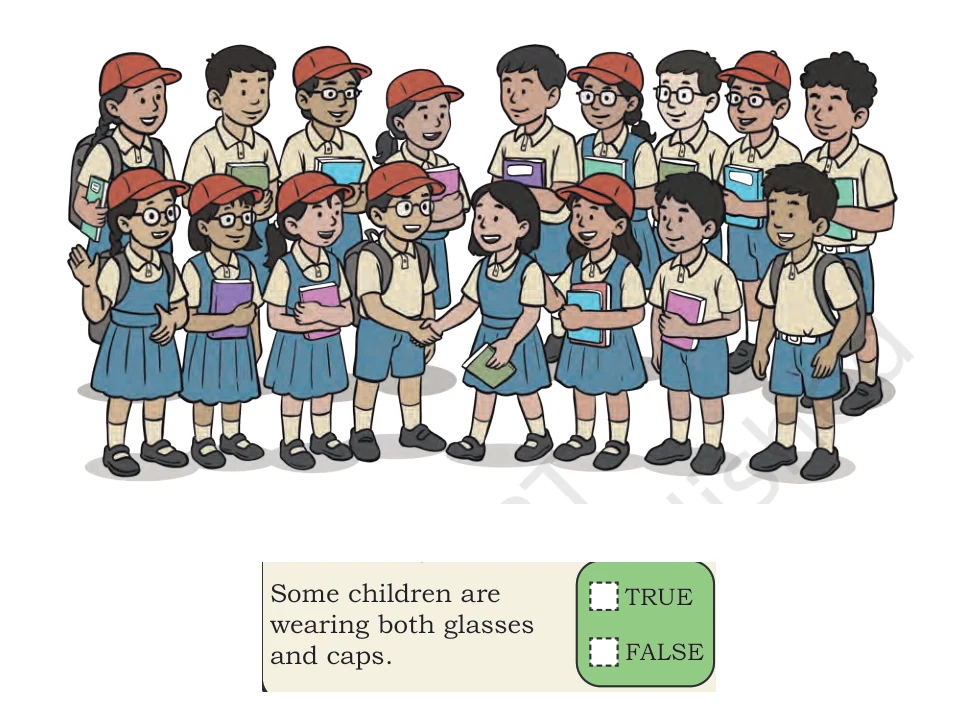
Some children are wearing both glasses and caps.
Show detailed solution
- Step 1: Check every child in the picture, not only the first row.
- Step 2: Several children, including the front-left girl, have both items.
- Step 3: Compare the observation with the exact words all, more, some, or no in the statement.
- Answer: True.
Textbook page 187 · solved item 58
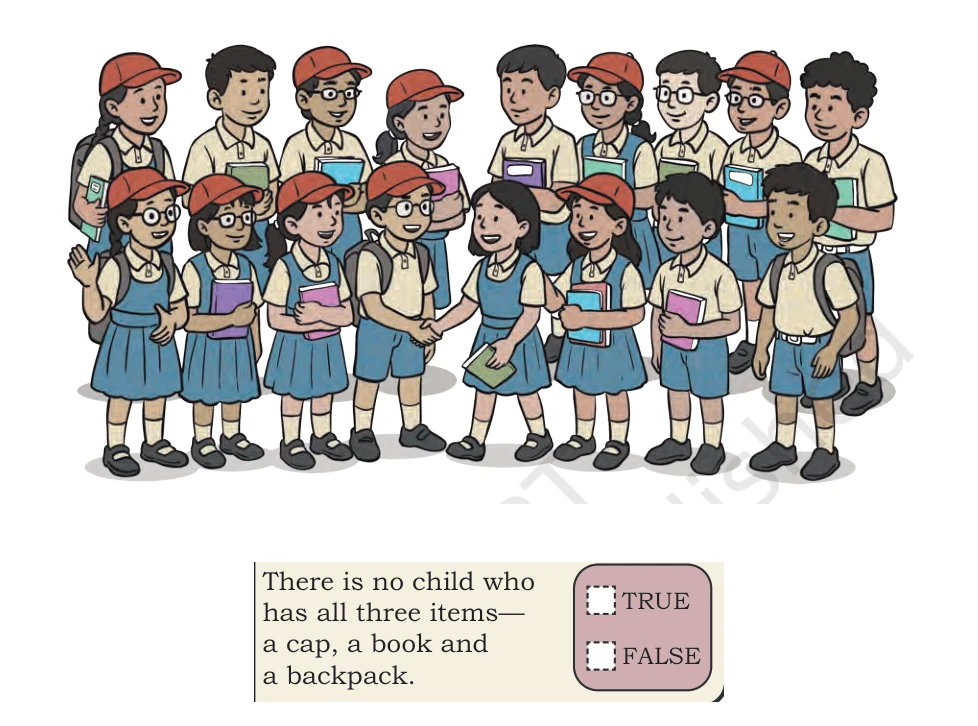
No child has a cap, a book, and a backpack together.
Show detailed solution
- Step 1: Check every child in the picture, not only the first row.
- Step 2: The girl at the back-left has a cap, holds a book, and wears a backpack.
- Step 3: Compare the observation with the exact words all, more, some, or no in the statement.
- Answer: False.