
Use the textbook context
Match, attempt, then check
Each source crop keeps the printed information needed for that item. Compound answer-key entries are separated into individual solutions.
Complete worked answers
Textbook page 1
Textbook page 1 · solved item 1
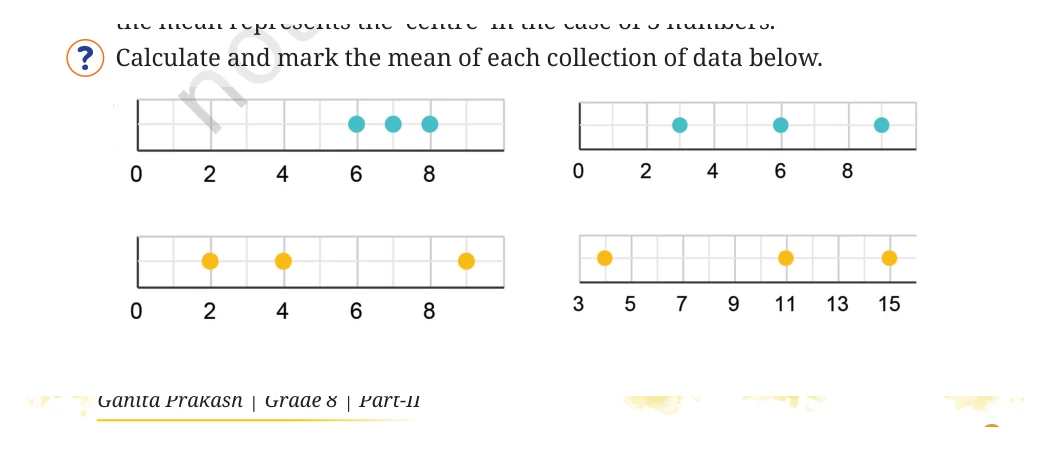
Calculate and mark the mean of each collection in the opening dot plots.
Show solution
For each collection, add all plotted values and divide by the number of dots. Mark that result on the number line. The mean is the balance point: the total horizontal distance of dots to its left equals the total distance of dots to its right.
Complete worked answers
Textbook page 2
Textbook page 2 · solved item 2
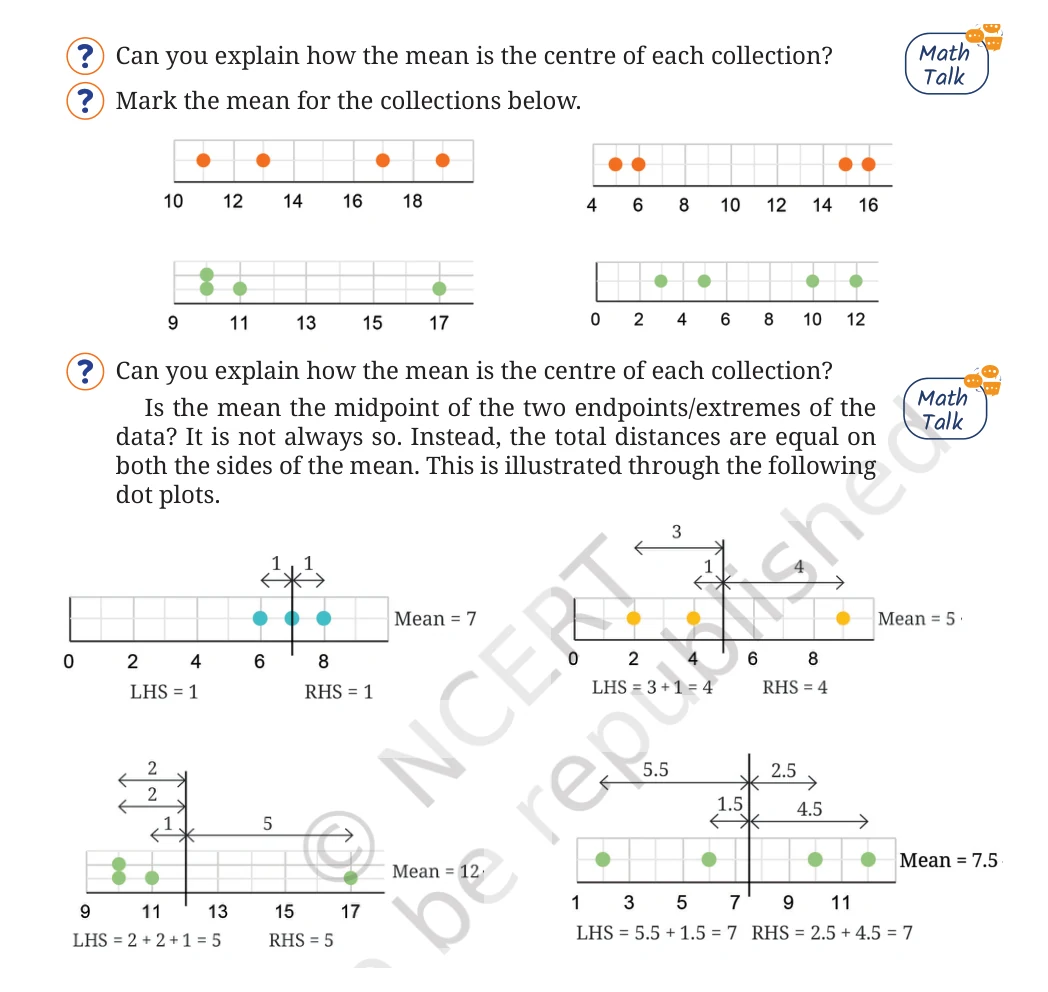
Explain how the mean is the centre of each collection. Is it always the midpoint of the two extremes?
Show solution
The mean is the unique balance point because the total deviations on its two sides are equal. It need not be the midpoint of the least and greatest values; repeated values affect the balance. Moving the proposed centre in either direction increases one side's total distance and decreases the other, so there cannot be a second centre.
Complete worked answers
Textbook page 3
Textbook page 3 · solved item 3
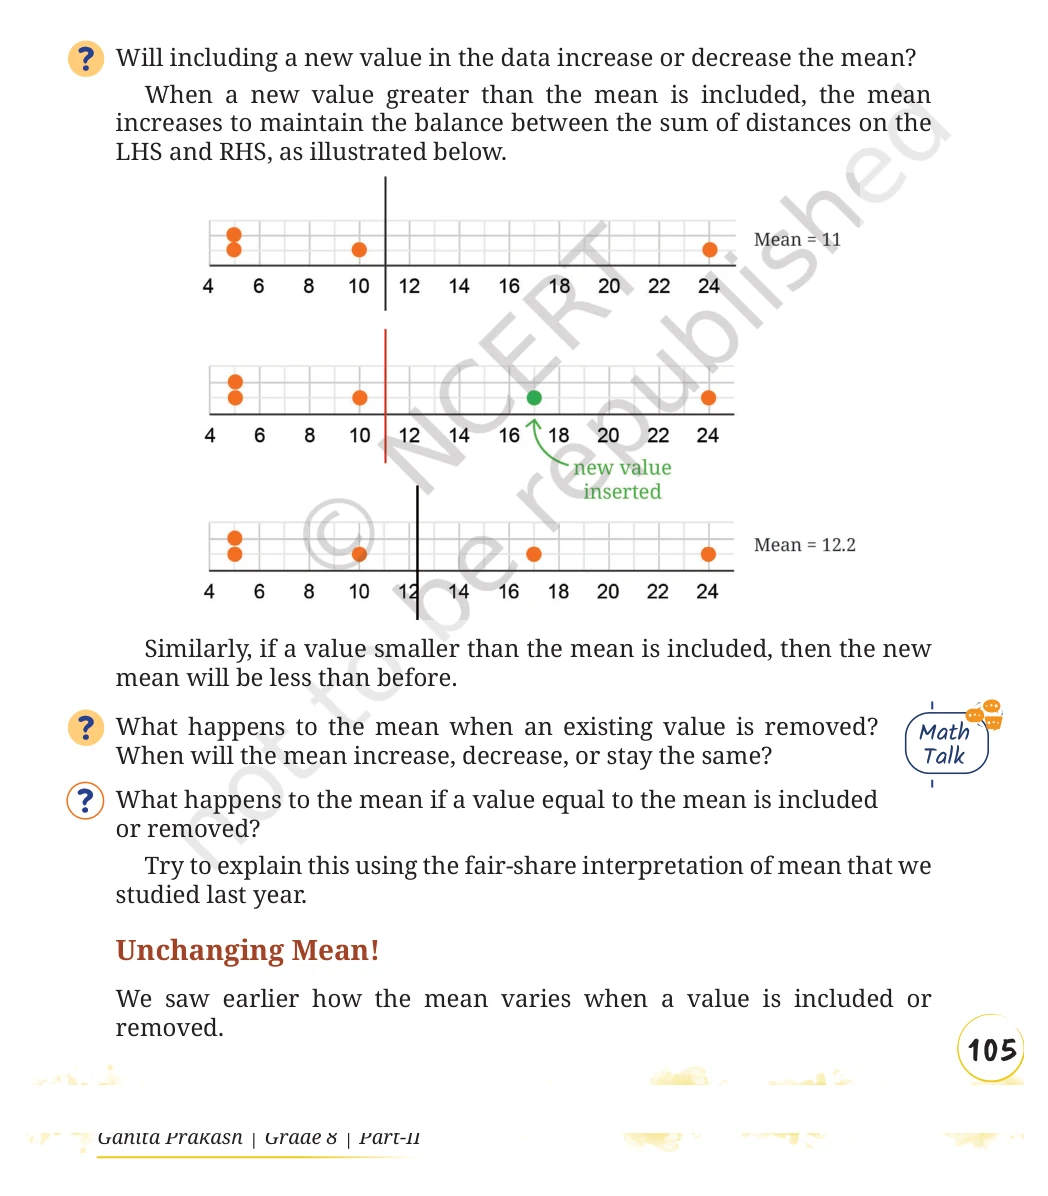
When does adding or removing a value increase, decrease, or preserve the mean?
Show solution
Adding a value above the current mean raises the mean; adding one below lowers it; adding one equal to it preserves it. Removing a value above the mean lowers the mean, removing one below raises it, and removing one equal to it preserves it. This follows from the fair-share interpretation.
Complete worked answers
Textbook page 4
Textbook page 4 · solved item 4
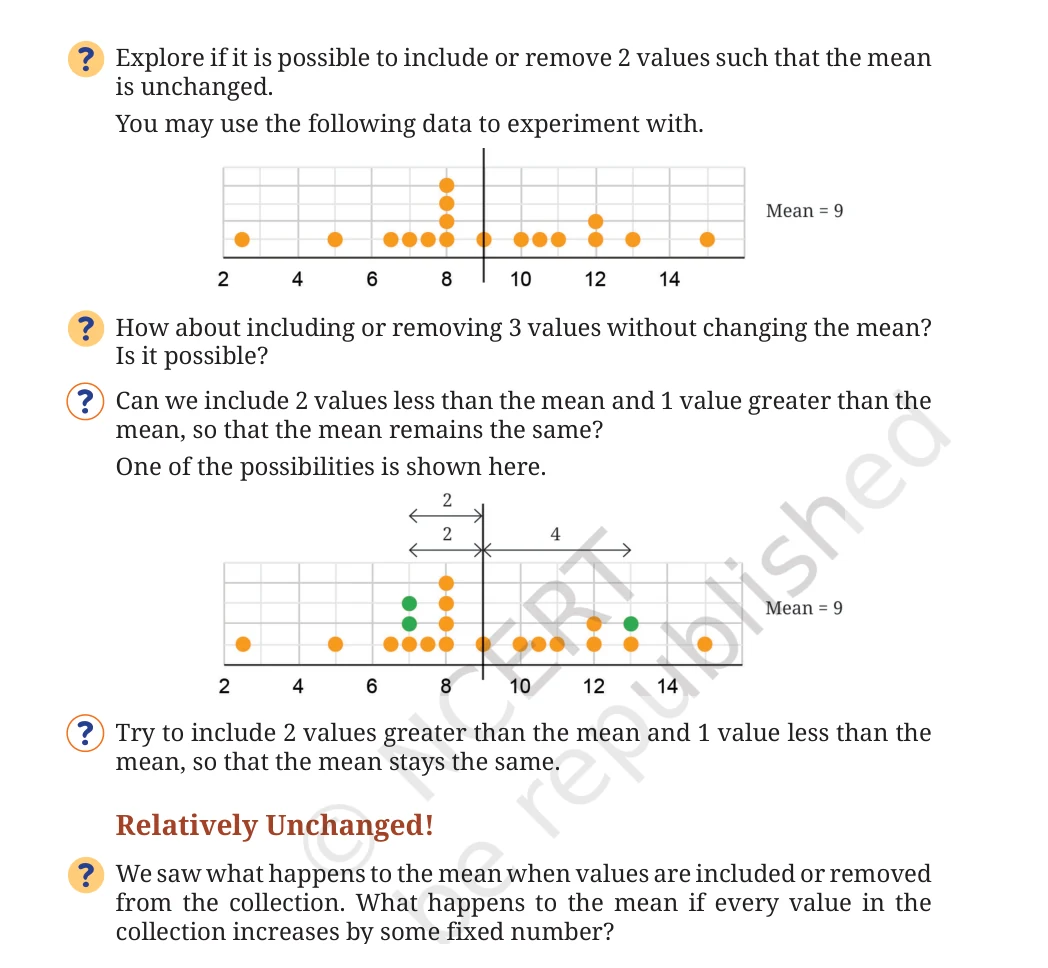
Can two or three values be added or removed without changing the mean?
Show solution
Yes. The added or removed values must themselves have the old mean. For mean (m), two values (m-d,m+d) work. Three values such as (m-a,m-b,m+a+b) also work, including two values below (m) and one above it; reversing the signs gives two above and one below.
Textbook page 4 · solved item 5
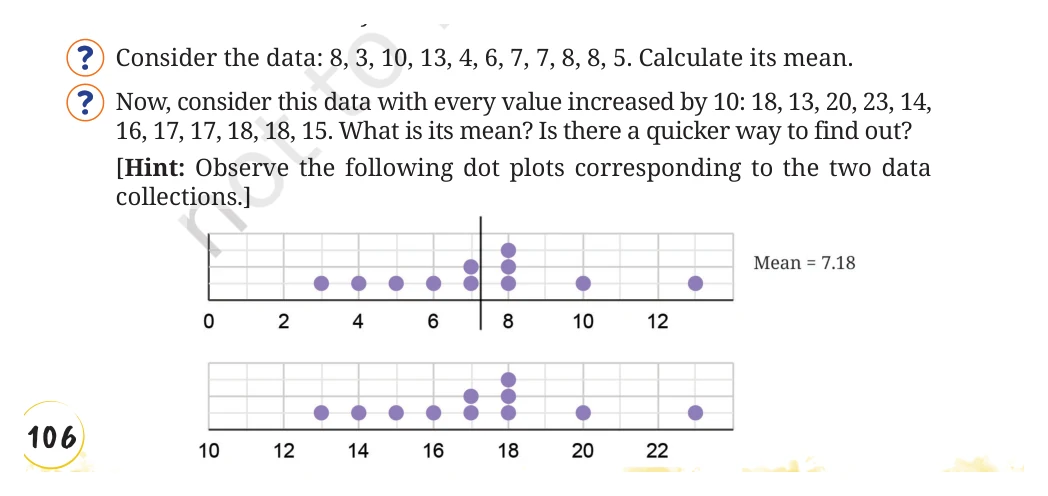
Find the mean of 8, 3, 10, 13, 4, 6, 7, 7, 8, 8, 5, and describe fixed changes to every value.
Show solution
The sum is 79, so the mean is (79/11\approx7.18). Adding 10 to every value gives mean (17.18); subtracting 1 gives (6.18); multiplying every value by 2 gives (14.36). In general, adding (c) changes mean (a) to (a+c), and multiplying by (k) changes it to (ka).
Complete worked answers
Textbook page 7
Textbook page 7 · solved item 6
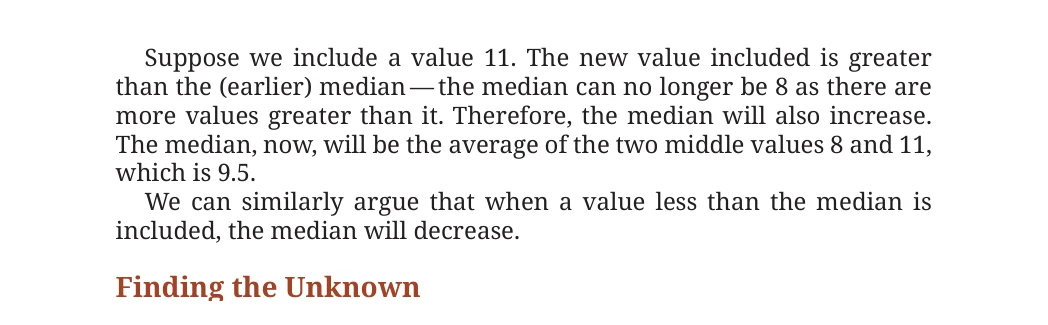
What happens to the median when 11 is included in the displayed data?
Show solution
The old median is 8. After including 11, the two middle values are 8 and 11, so the new median is ((8+11)/2=9.5). More generally, inserting a value above the median cannot lower it, while inserting one below cannot raise it.
Textbook page 7 · solved item 7
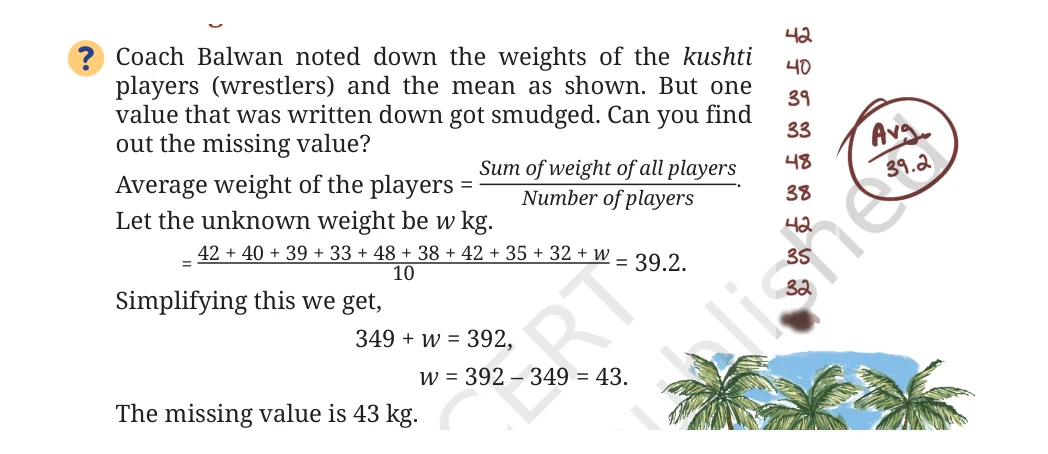
Find the smudged wrestler's weight.
Show solution
Let the missing weight be (w). Then ((349+w)/10=39.2), so (349+w=392) and (w=43). The missing weight is 43 kg.
Textbook page 7 · solved item 8
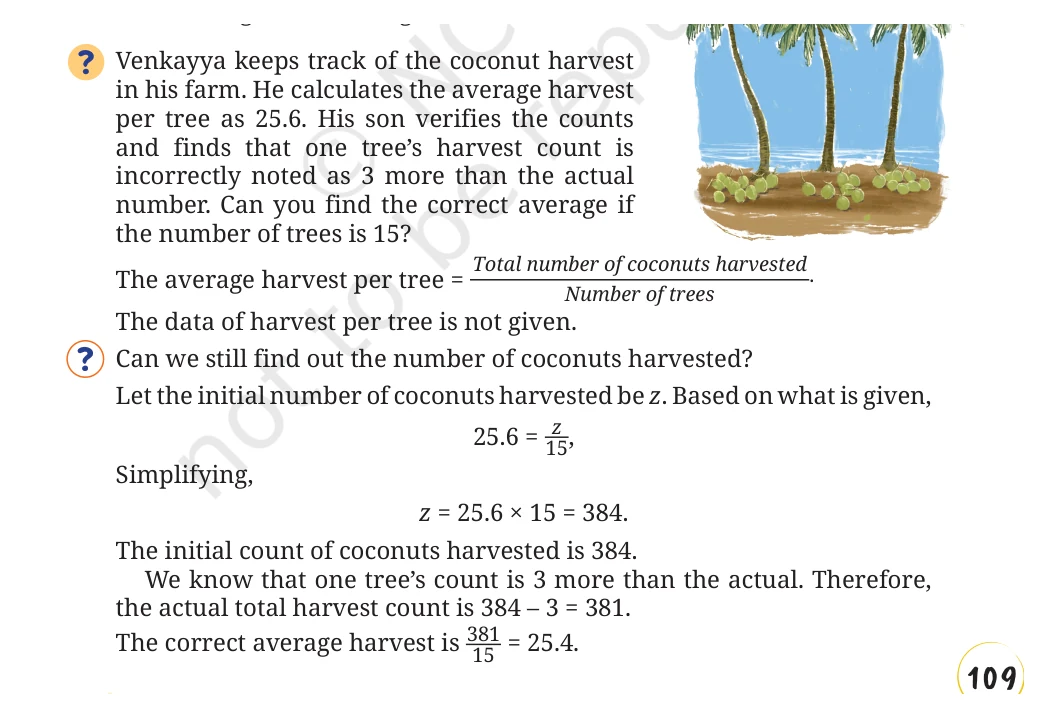
Correct the coconut harvest average when one count was recorded 3 too high.
Show solution
The recorded total was (25.6\times15=384). The correct total is (384-3=381), so the correct average is (381/15=25.4) coconuts per tree.
Complete worked answers
Textbook page 8
Textbook page 8 · solved item 9
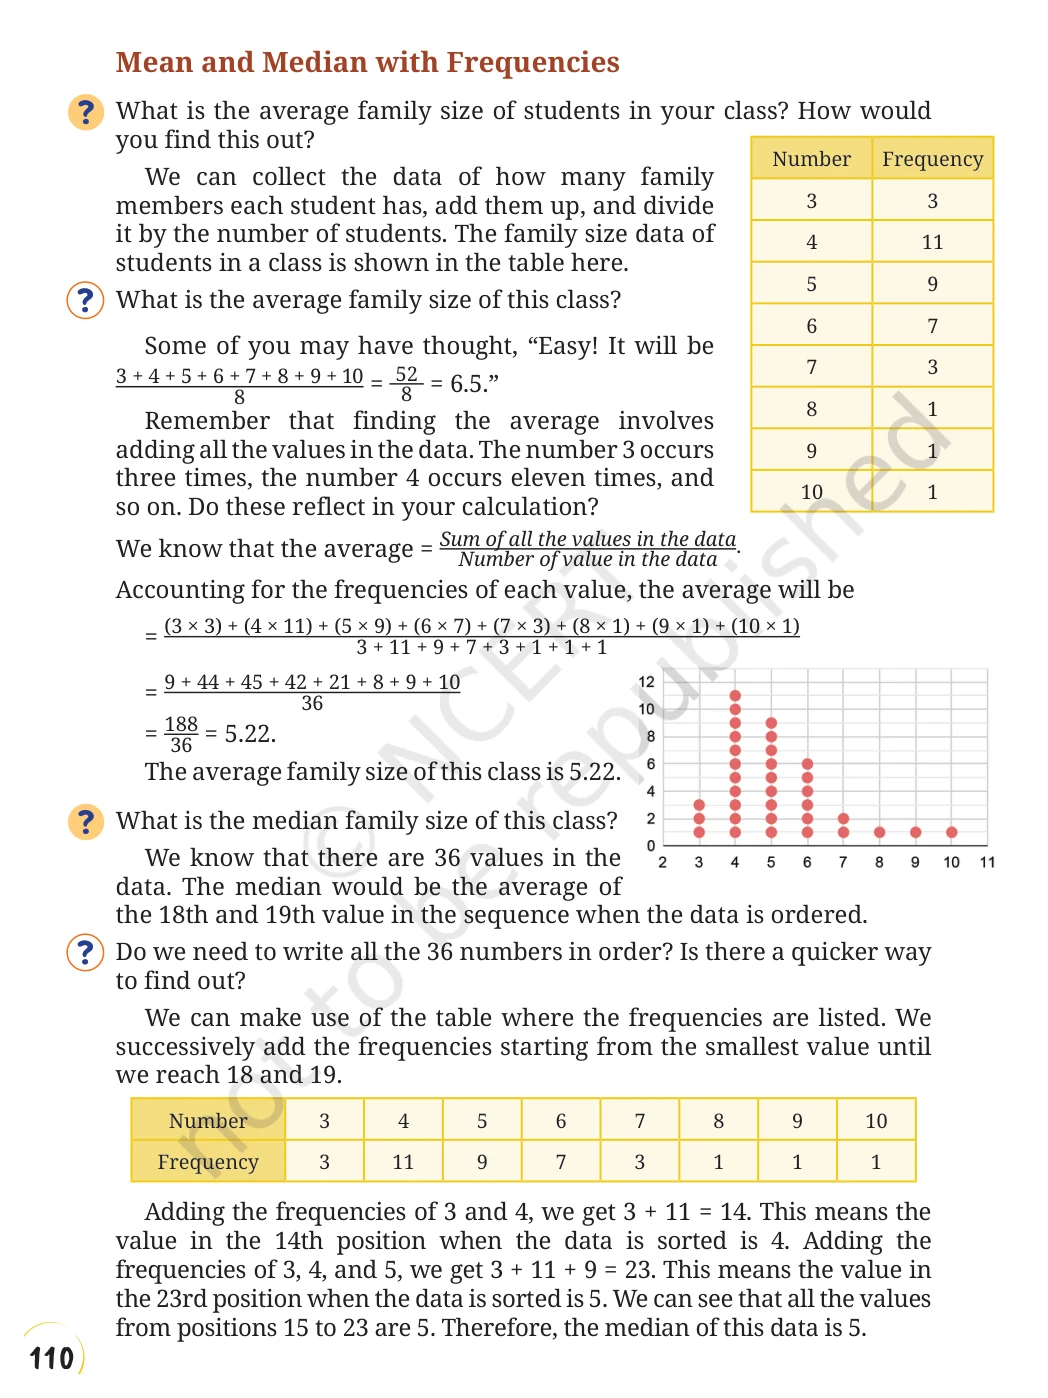
Find the mean and median family size from the frequency table.
Show solution
There are 36 students and the weighted total is (3(3)+4(11)+5(9)+6(7)+7(3)+8+9+10=188). Thus the mean is (188/36\approx5.22). Positions 18 and 19 both lie among the nine 5s (positions 15 through 23), so the median is 5.
Complete worked answers
Textbook page 10
Textbook page 10 · solved item 10
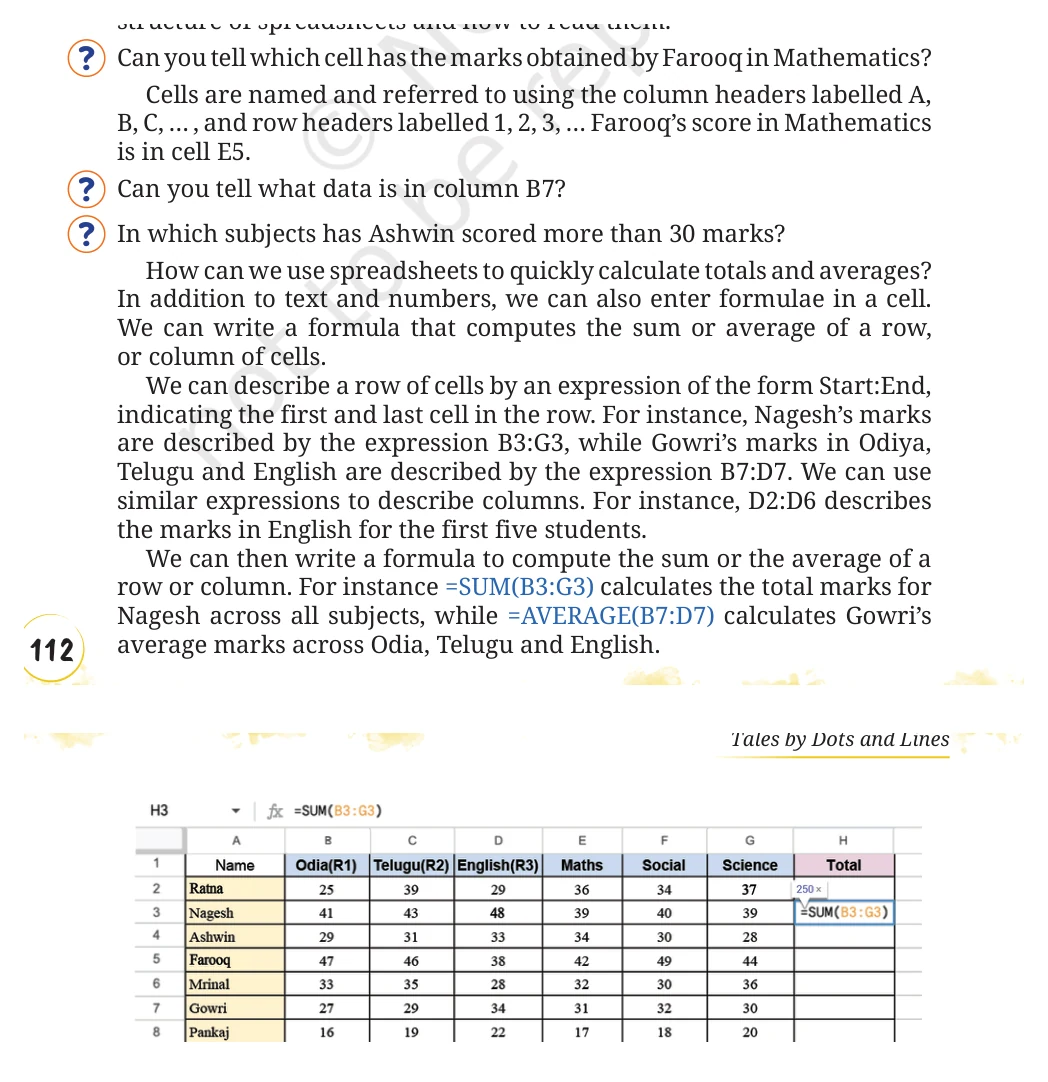
Read the spreadsheet cells and identify Ashwin's marks above 30.
Show solution
Farooq's Mathematics mark is in E5. Cell B7 contains 27, Gowri's Odia mark. Ashwin scored above 30 in Telugu (31), English (33), and Mathematics (34); Social Science is exactly 30, so it is excluded.
Complete worked answers
Textbook page 11
Textbook page 11 · solved item 11
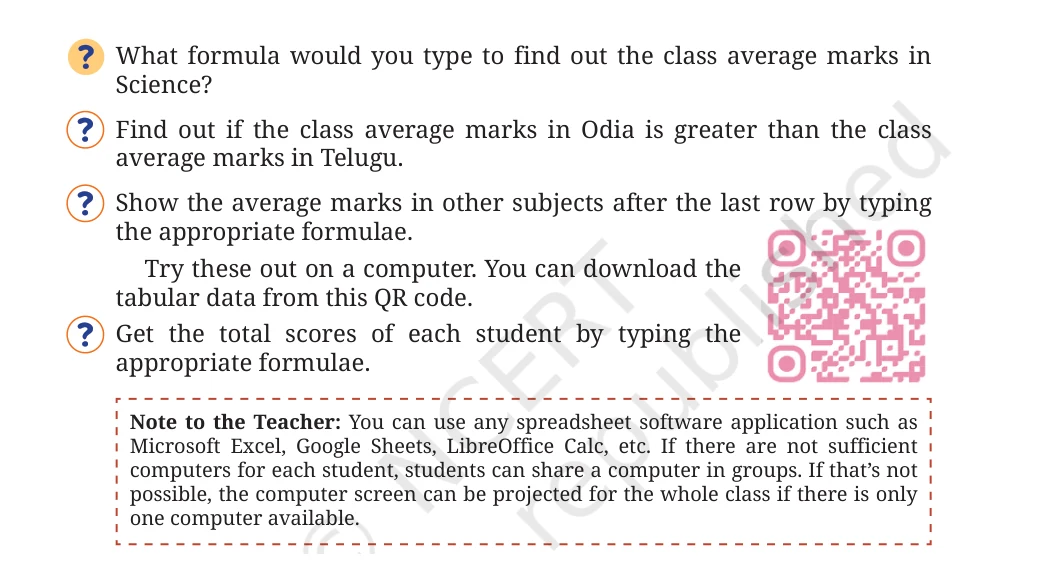
Write spreadsheet formulas for subject averages and student totals, and report the results.
Show solution
Science average: =AVERAGE(G2:G23), which is about 33.14. Odia averages about 31.23 while Telugu averages about 33.59, so Odia is not greater. Enter =AVERAGE(B2:B23) through =AVERAGE(G2:G23) for all subjects. Enter =SUM(B2:G2) for Ratna and fill down; the totals are 200, 250, 185, 266, 194, 183, 112, 248, 225, 102, 273, 147, 188, 148, 213, 242, 232, 197, 103, 177, 246, 183.
Textbook page 11 · solved item 12

Find the means of the first 50 natural numbers, first 50 odd numbers, and first 50 multiples of 4.
Show solution
For an arithmetic sequence, the mean is the average of its first and last terms. Hence the answers are ((1+50)/2=25.5), ((1+99)/2=50), and ((4+200)/2=102).
Textbook page 11 · solved item 13
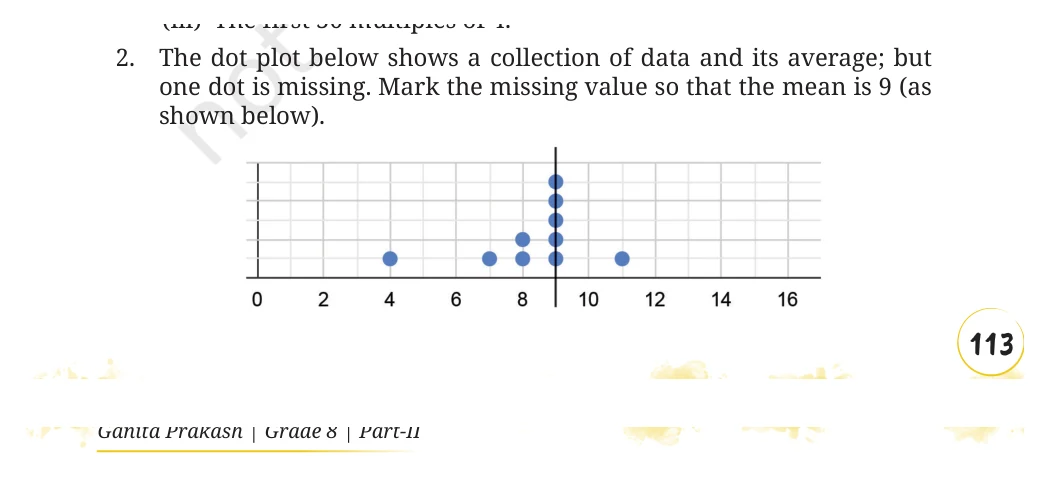
Place the missing dot so that the displayed dot plot has mean 9.
Show solution
The 10 visible dots total (83). With one missing dot, the required total is (11\times9=99). Therefore the missing value is (99-83=16); place the dot at 16.
Complete worked answers
Textbook page 12
Textbook page 12 · solved item 14
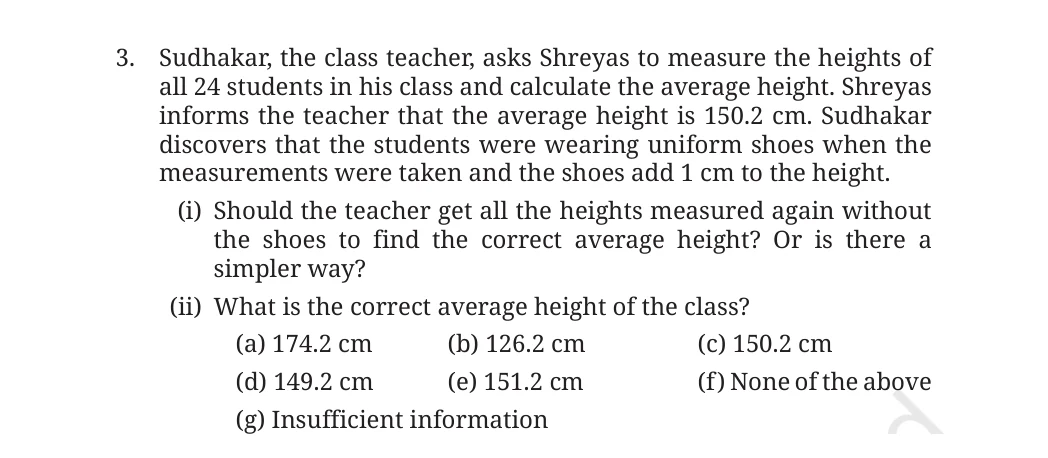
Correct the class average height after removing the 1 cm shoe height.
Show solution
There is no need to measure everyone again. Every recorded height is 1 cm too large, so the mean is also 1 cm too large. The correct mean is 150.2 - 1 = 149.2 cm, choice (d).
Textbook page 12 · solved item 15
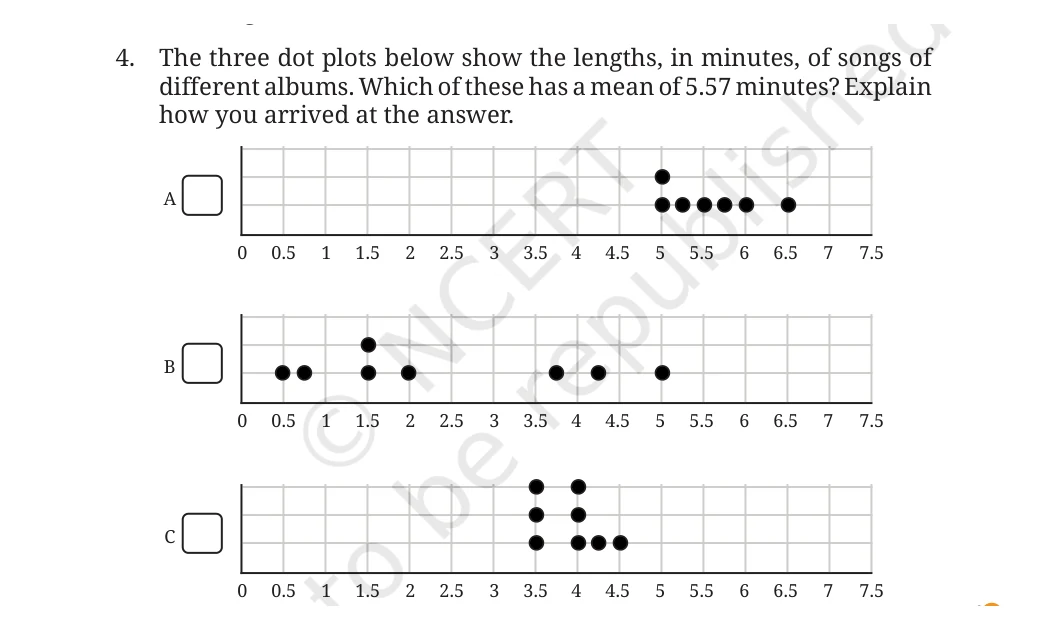
Which song-length dot plot has mean 5.57 minutes?
Show solution
Plot A. Its seven values are (5,5,5.25,5.5,5.75,6,6.5), whose sum is 39. Thus its mean is (39/7\approx5.57) minutes.
Textbook page 12 · solved item 16
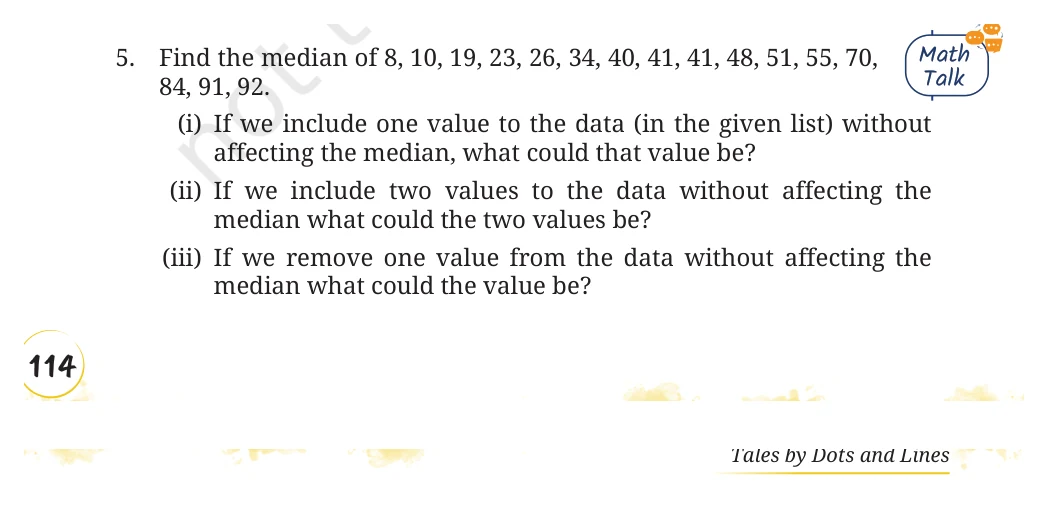
Find the median of the 16 values and modify the data without changing it.
Show solution
The middle values are 41 and 41, so the median is 41. One value: add 41. Two values: add 40 and 48 (many pairs preserving the two middle 41s work). One removal: remove an extreme such as 8; the middle value of the remaining 15 values is still 41.
Complete worked answers
Textbook page 13
Textbook page 13 · solved item 17
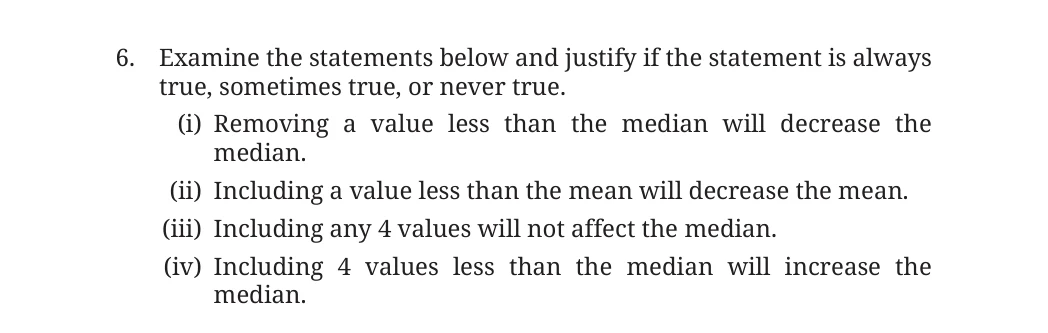
Classify the four statements about changing a median or mean.
Show solution
(i) Sometimes true: removing a below-median value may lower the median or leave it unchanged. (ii) Always true when the inserted value is strictly below the old mean. (iii) Sometimes true: four suitably placed values can preserve the median, but arbitrary ones need not. (iv) Never true: adding four values below the median cannot increase it.
Textbook page 13 · solved item 18

If the mean of 8, 13, 10, 4, 5, 20, y, 10 is 10.375, find y.
Show solution
The required total is (8\times10.375=83). The known values total 70, so (y=83-70=13).
Textbook page 13 · solved item 19

A set of 15 values has mean 134. Find its sum.
Show solution
Sum = number of values × mean, so the sum is (15\times134=2010).
Textbook page 13 · solved item 20

Which proposed values of p make the median 29?
Show solution
After sorting the ten fixed values, 29 is in the sixth position unless p is below 29. Thus p can be 40, 100, 29, 47, or 30: choices (iii), (iv), (v), (vi), and (vii).
Textbook page 13 · solved item 21
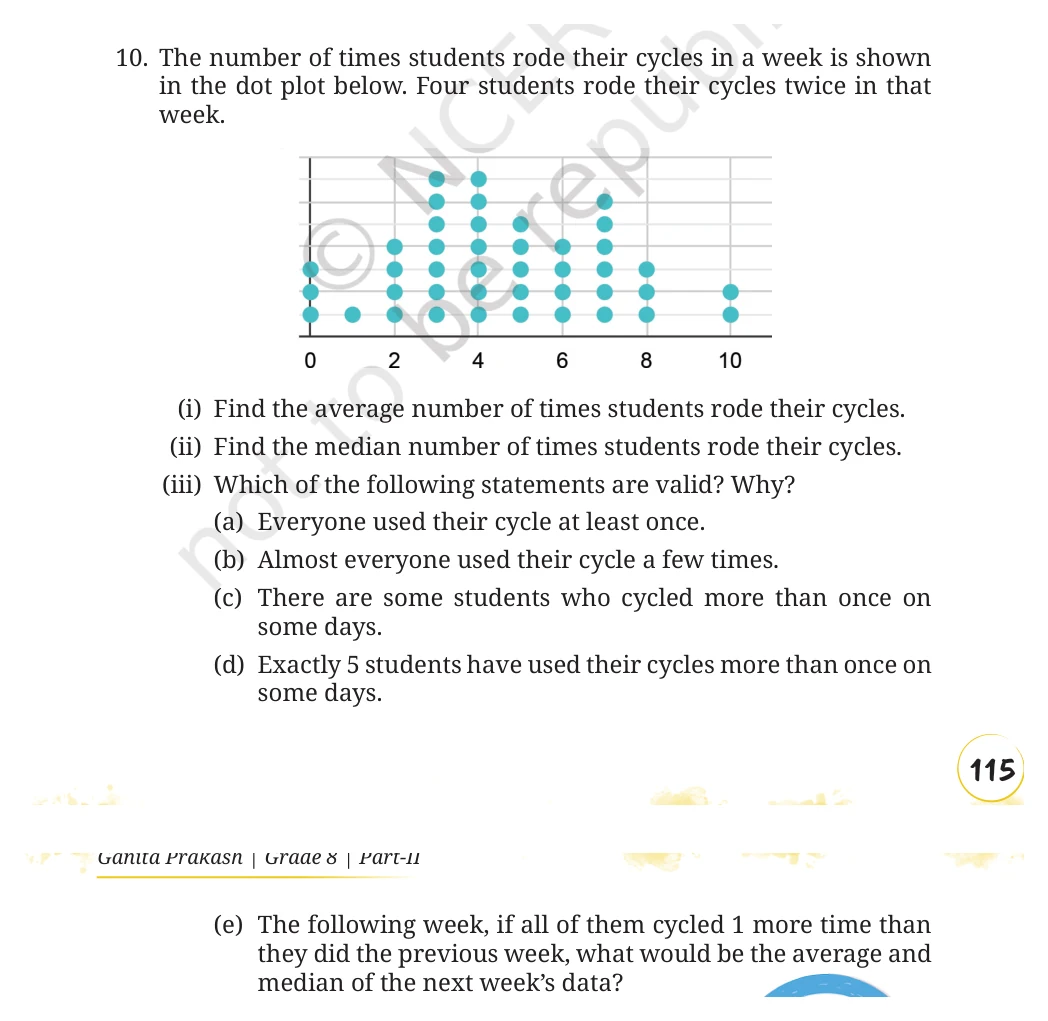
Find and interpret the cycle-use dot plot's mean and median.
Show solution
The frequencies give 43 students and a total of 197 rides, so the mean is (197/43\approx4.58). The 22nd value is 4, so the median is 4. Statement (a) is false because three students rode zero times. (b) is a reasonable summary. Statements (c) and (d) cannot be inferred: weekly totals do not reveal which days had multiple rides.
If everyone rides once more next week, both mean and median rise by 1, to about 5.58 and 5.
Complete worked answers
Textbook page 14
Textbook page 14 · solved item 22
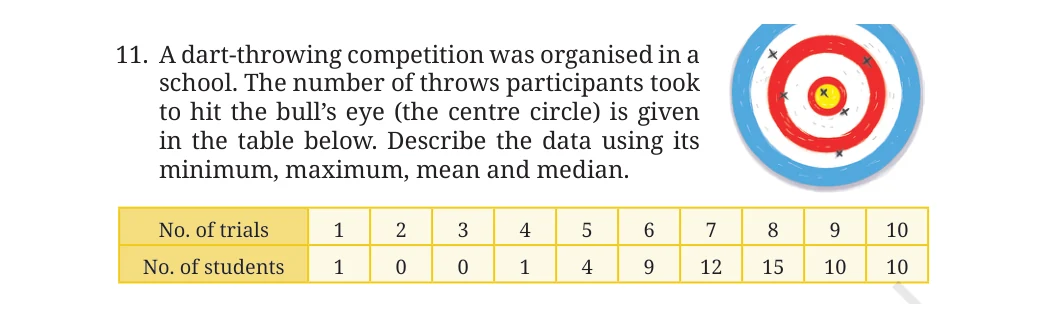
Describe the dart-throwing data using minimum, maximum, mean, and median.
Show solution
There are 62 students. The minimum is 1 trial and maximum is 10 trials. The weighted sum is 473, so the mean is (473/62\approx7.63). Positions 31 and 32 are both 8, so the median is 8.
Textbook page 14 · solved item 23
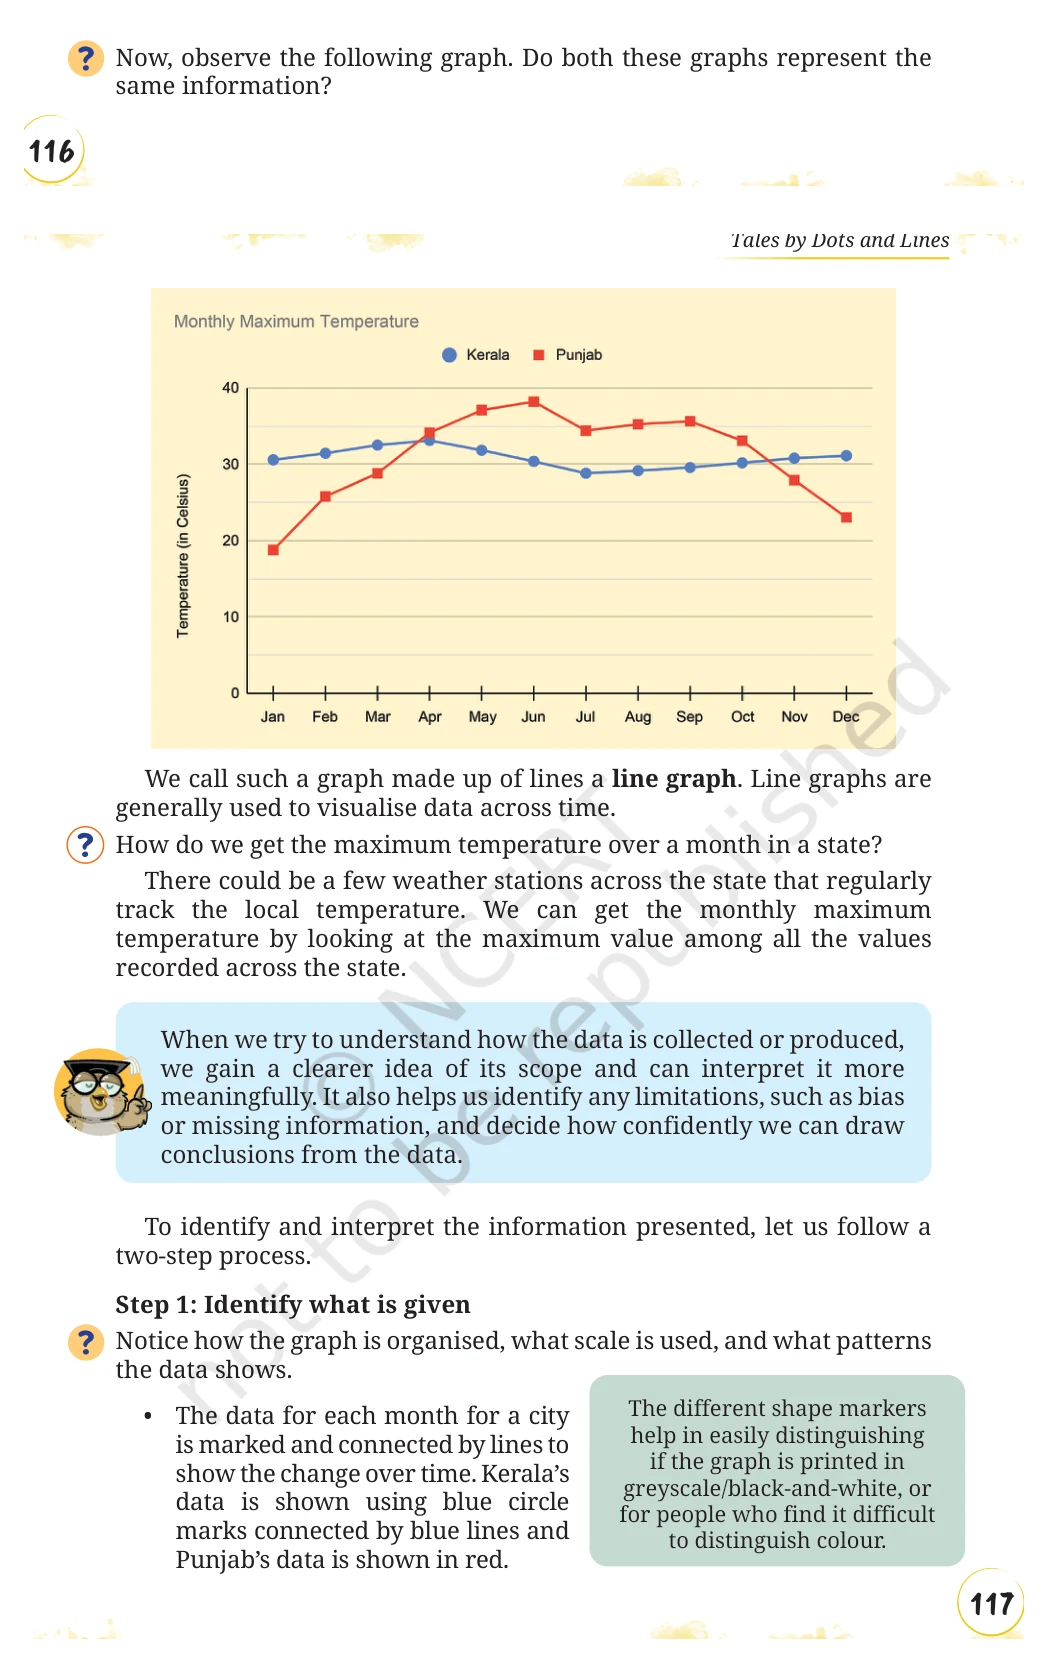
Do the column graph and line graph show the same temperature information? Interpret the trends.
Show solution
Yes; they encode the same monthly maximum temperatures. Punjab varies greatly, from about 19°C in January to 38°C in June, then falls. Kerala stays roughly 29-33°C, peaking around April. A monthly-minimum graph would use the same months and method but plot each month's minimum readings.
Complete worked answers
Textbook page 17
Textbook page 17 · solved item 24
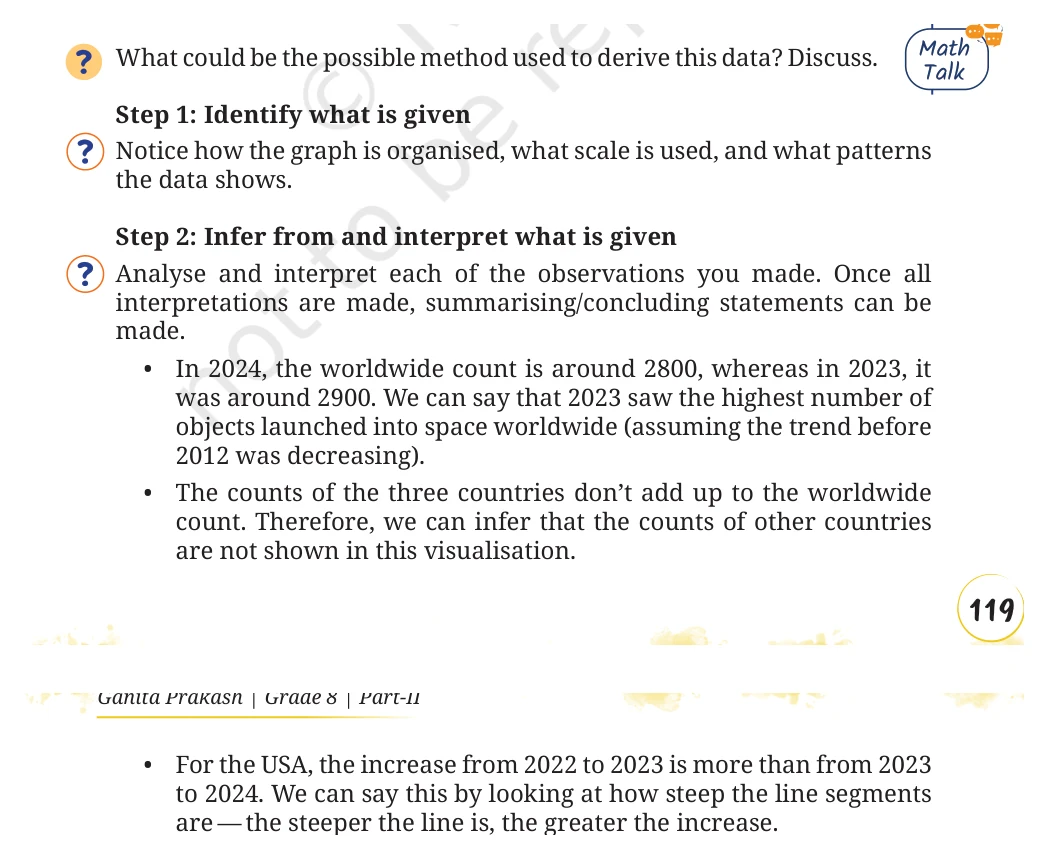
How might the annual space-launch data have been compiled?
Show solution
A suitable method is to combine official launch records from national agencies and operators, count every qualifying object placed into Earth orbit or beyond by launch year and country, remove duplicate records, and then aggregate country and worldwide totals using one consistent definition.
Complete worked answers
Textbook page 18
Textbook page 18 · solved item 25
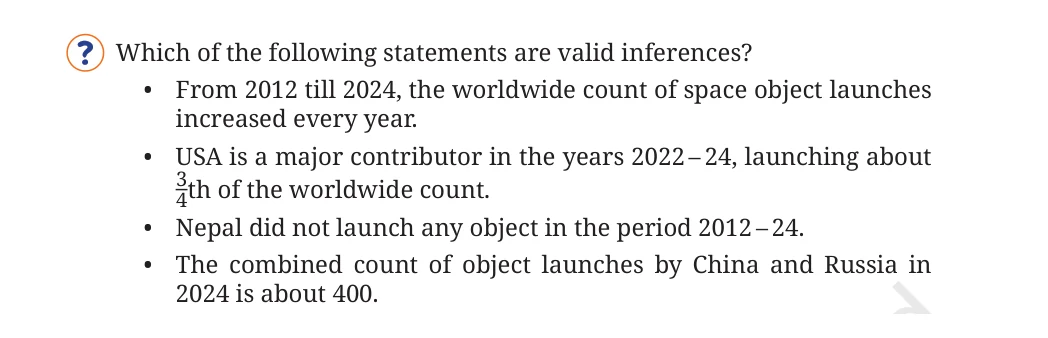
Which statements are valid inferences from the space-launch graph?
Show solution
The first is invalid because worldwide launches fall in some years, including 2024. The USA three-fourths statement is a valid approximation for 2022-24. The Nepal statement is invalid because an unshown country cannot be treated as zero. China plus Russia in 2024 is about 400, so the fourth is valid.
Textbook page 18 · solved item 26
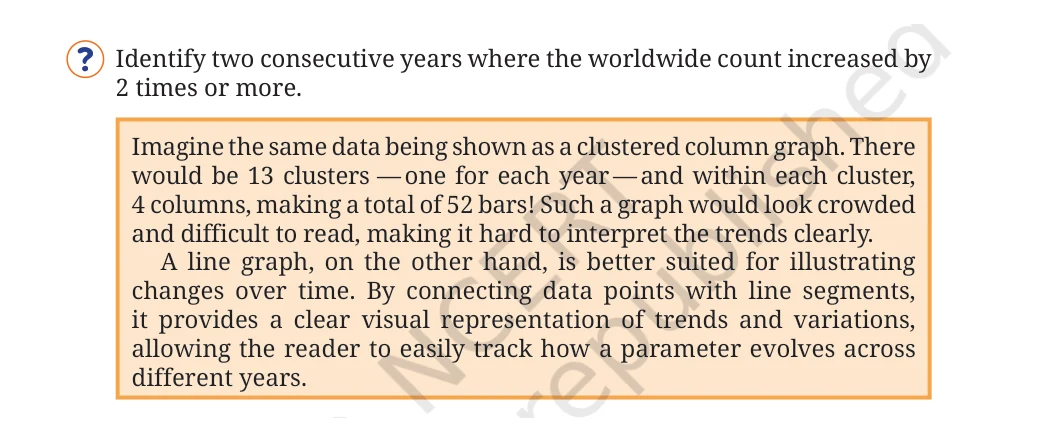
Identify consecutive years when the worldwide launch count at least doubled.
Show solution
From the plotted points, 2016 to 2017 rises from roughly 200 to about 500, more than doubling. No other adjacent pair shown clearly reaches twice the previous year's value.
Complete worked answers
Textbook page 19
Textbook page 19 · solved item 27
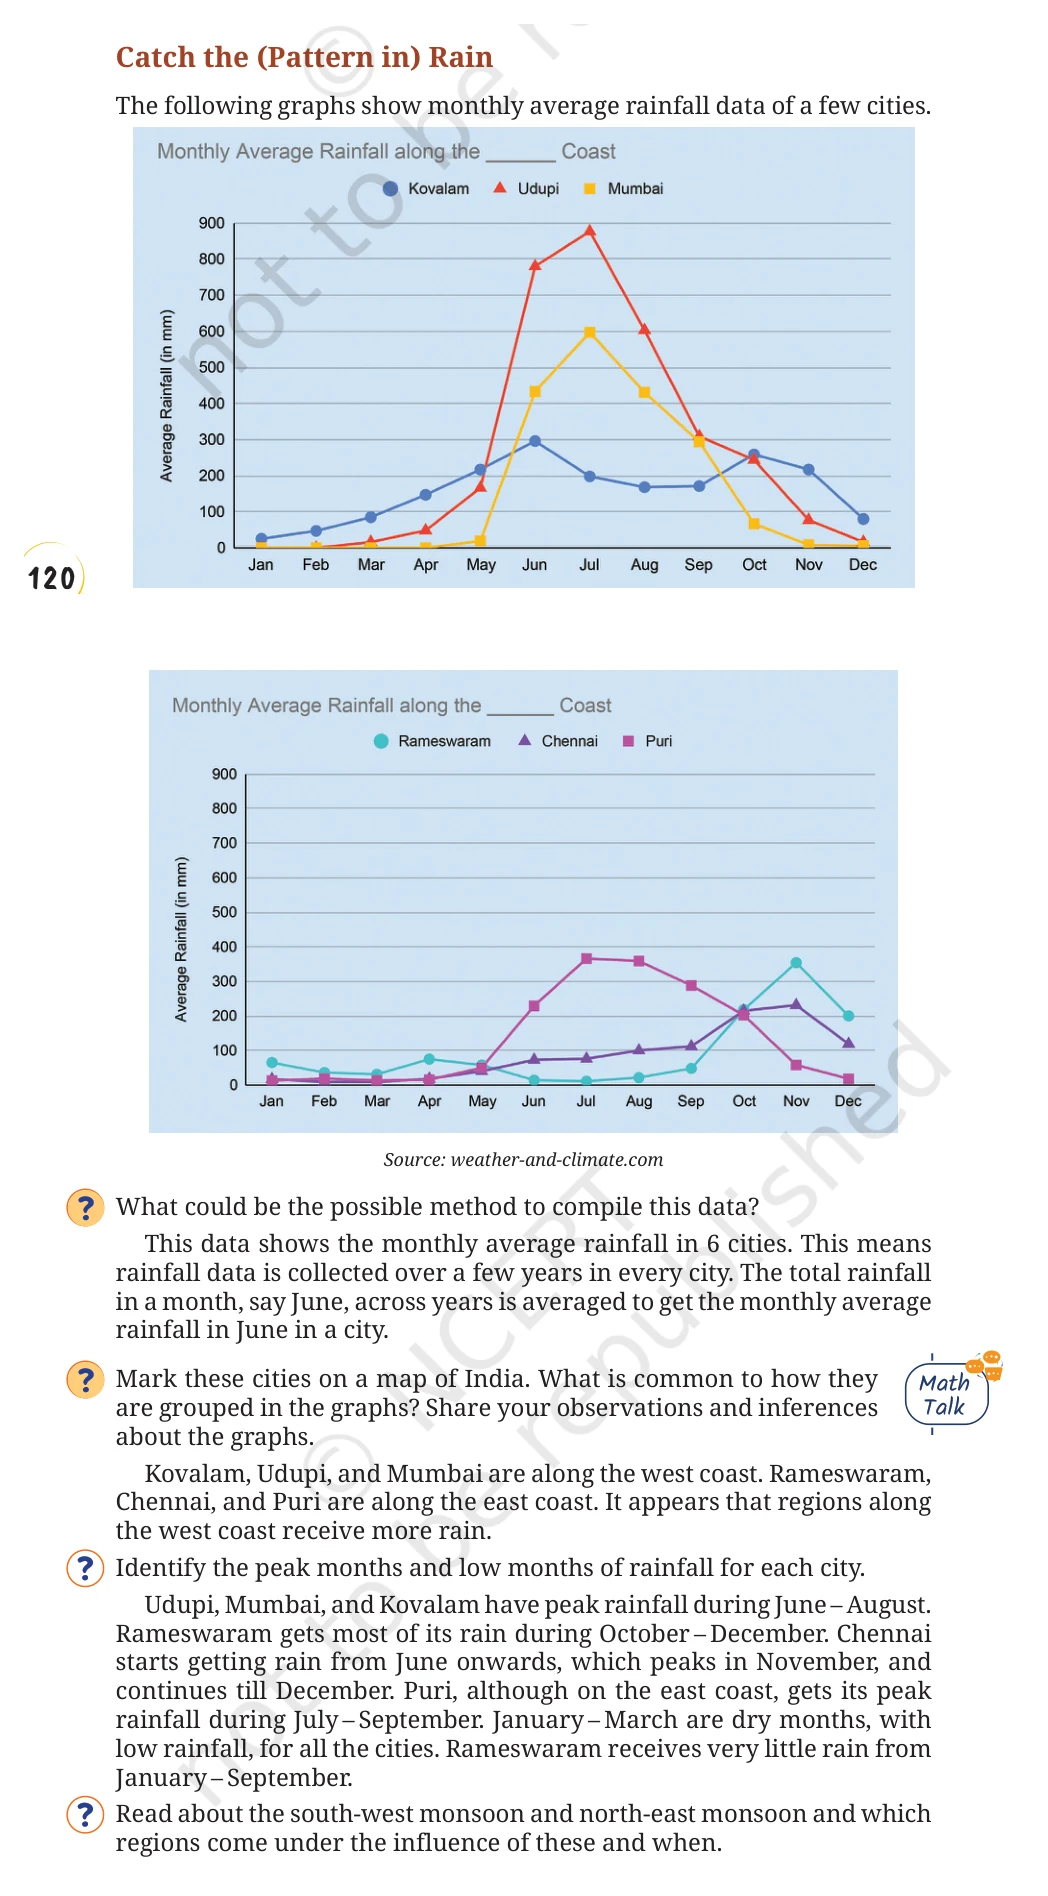
Compile and interpret the six-city rainfall graphs.
Show solution
Average each calendar month's rainfall across several years at each weather station. Kovalam, Udupi, and Mumbai form the west-coast group; Rameswaram, Chennai, and Puri form the east-coast group. West-coast peaks occur mainly June-August; Rameswaram peaks October-December, Chennai around November, and Puri July-September.
January-March are generally dry.
Complete worked answers
Textbook page 20
Textbook page 20 · solved item 28
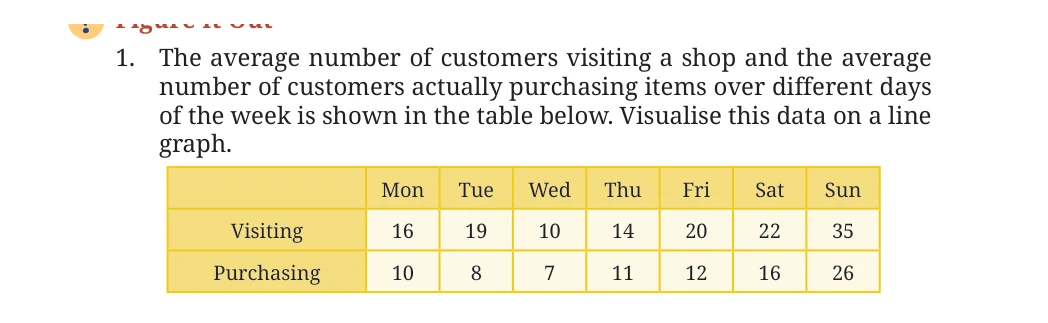
Plot the shop's visiting and purchasing data as a line graph.
Show solution
Put Monday-Sunday on the horizontal axis and customer count on the vertical axis. Plot visiting as (16, 19, 10, 14, 20, 22, 35) and purchasing as (10, 8, 7, 11, 12, 16, 26), then join each series separately. Both peak on Sunday; purchasing remains below visiting every day.
Textbook page 20 · solved item 29
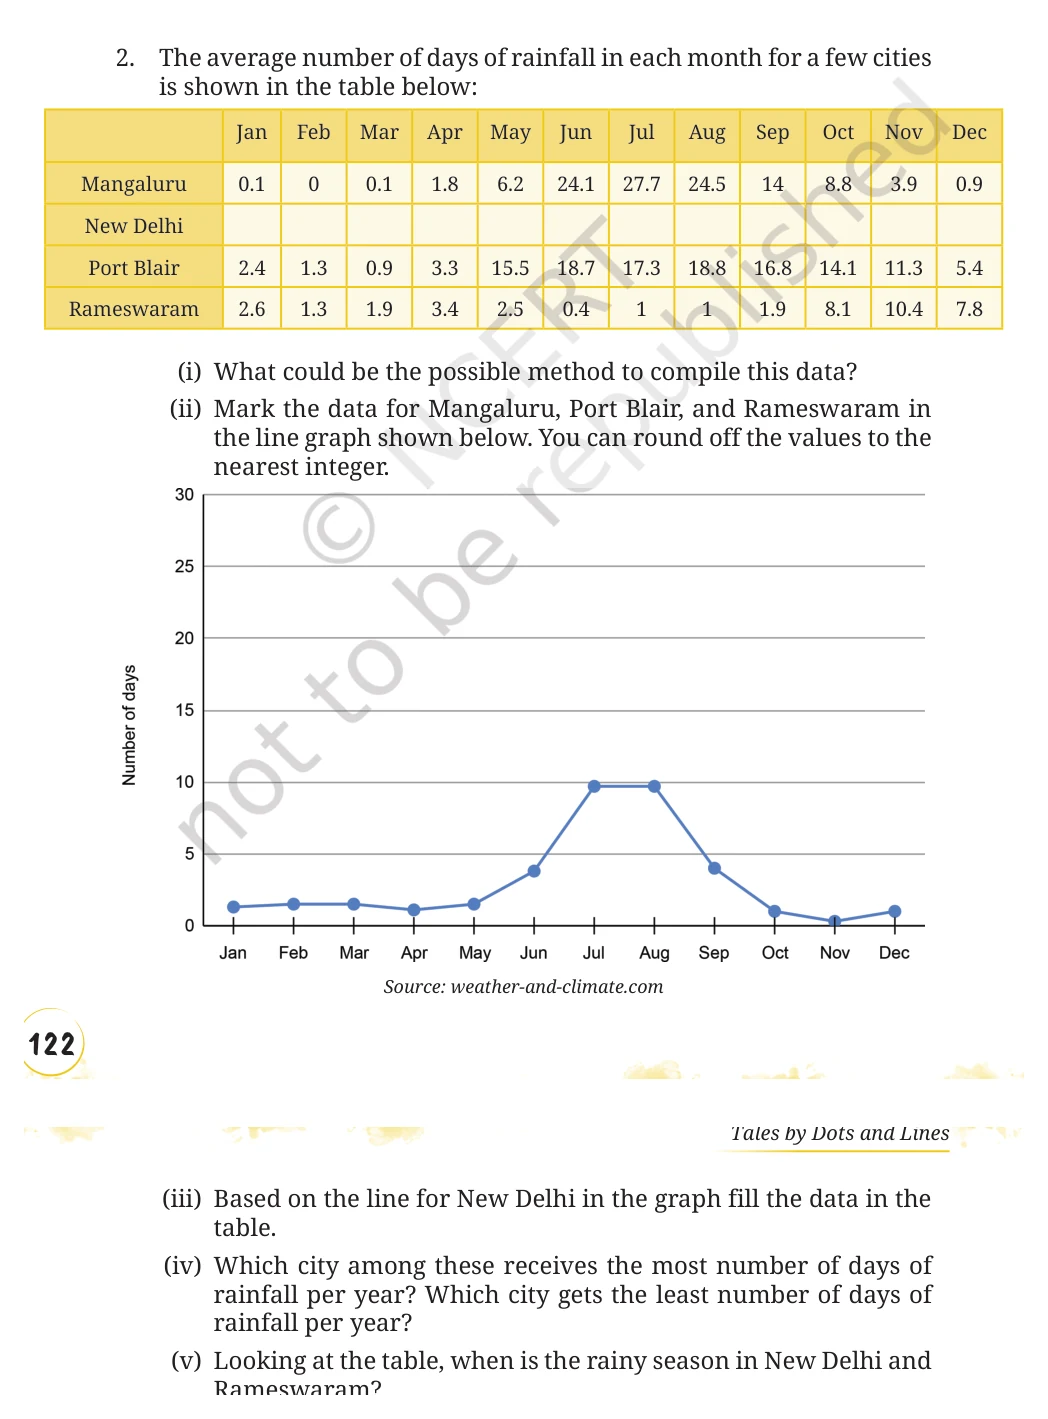
Complete and interpret the rainfall-days table and graph.
Show solution
Plot the three table rows after rounding. Reading New Delhi's line gives about 1, 1, 1, 1, 1, 4, 10, 10, 4, 1, 0, 1 days from January to December. Annual totals are about 112.1 for Mangaluru, 125.8 for Port Blair, 42.3 for Rameswaram, and 35 for New Delhi. Port Blair is highest and New Delhi lowest.
New Delhi's rain season is July-August (broader monsoon June-September); Rameswaram's is October-December.
Complete worked answers
Textbook page 21
Textbook page 21 · solved item 30
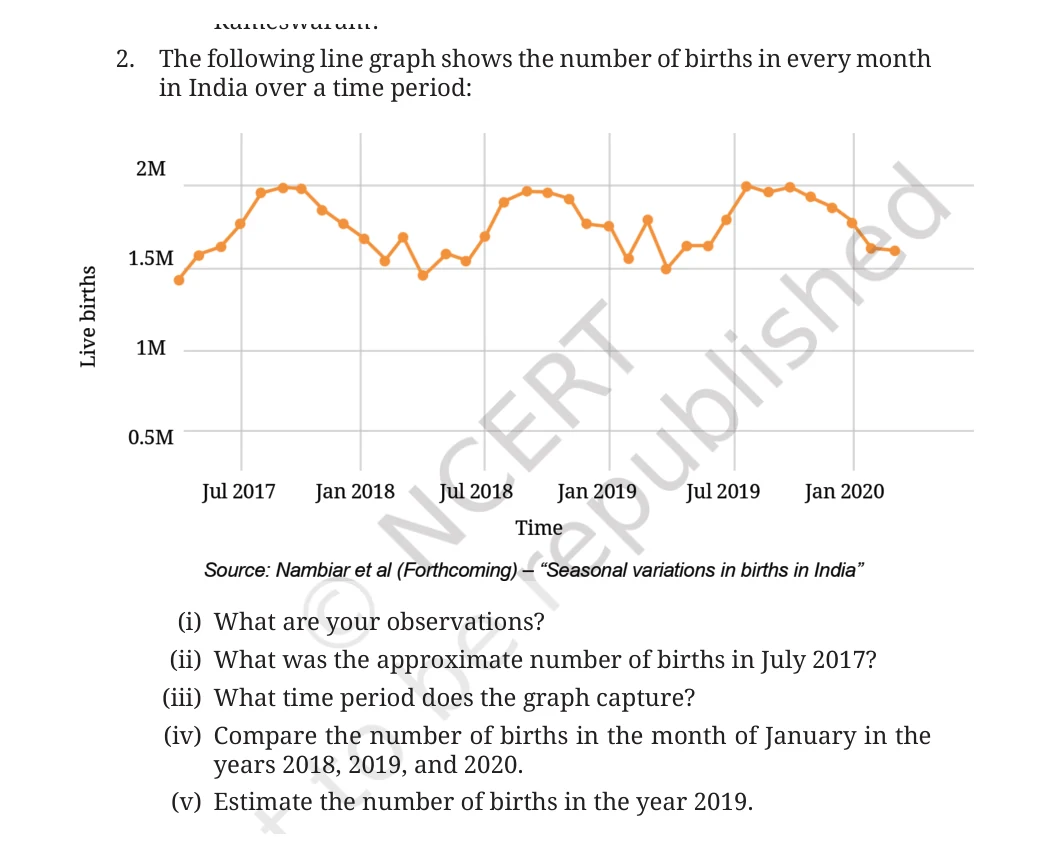
Read and analyse the monthly births line graph.
Show solution
Births show a repeating seasonal cycle: peaks near 1.9 million around September-November and lows near 1.4-1.5 million around spring. July 2017 is about 1.7 million. The graph runs approximately April 2017 to March 2020. January is about 1.7M in 2018, 1.65M in 2019, and 1.75M in 2020. Summing the twelve approximate 2019 readings gives about 20 million births; graph readings are estimates.
Complete worked answers
Textbook page 22
Textbook page 22 · solved item 31
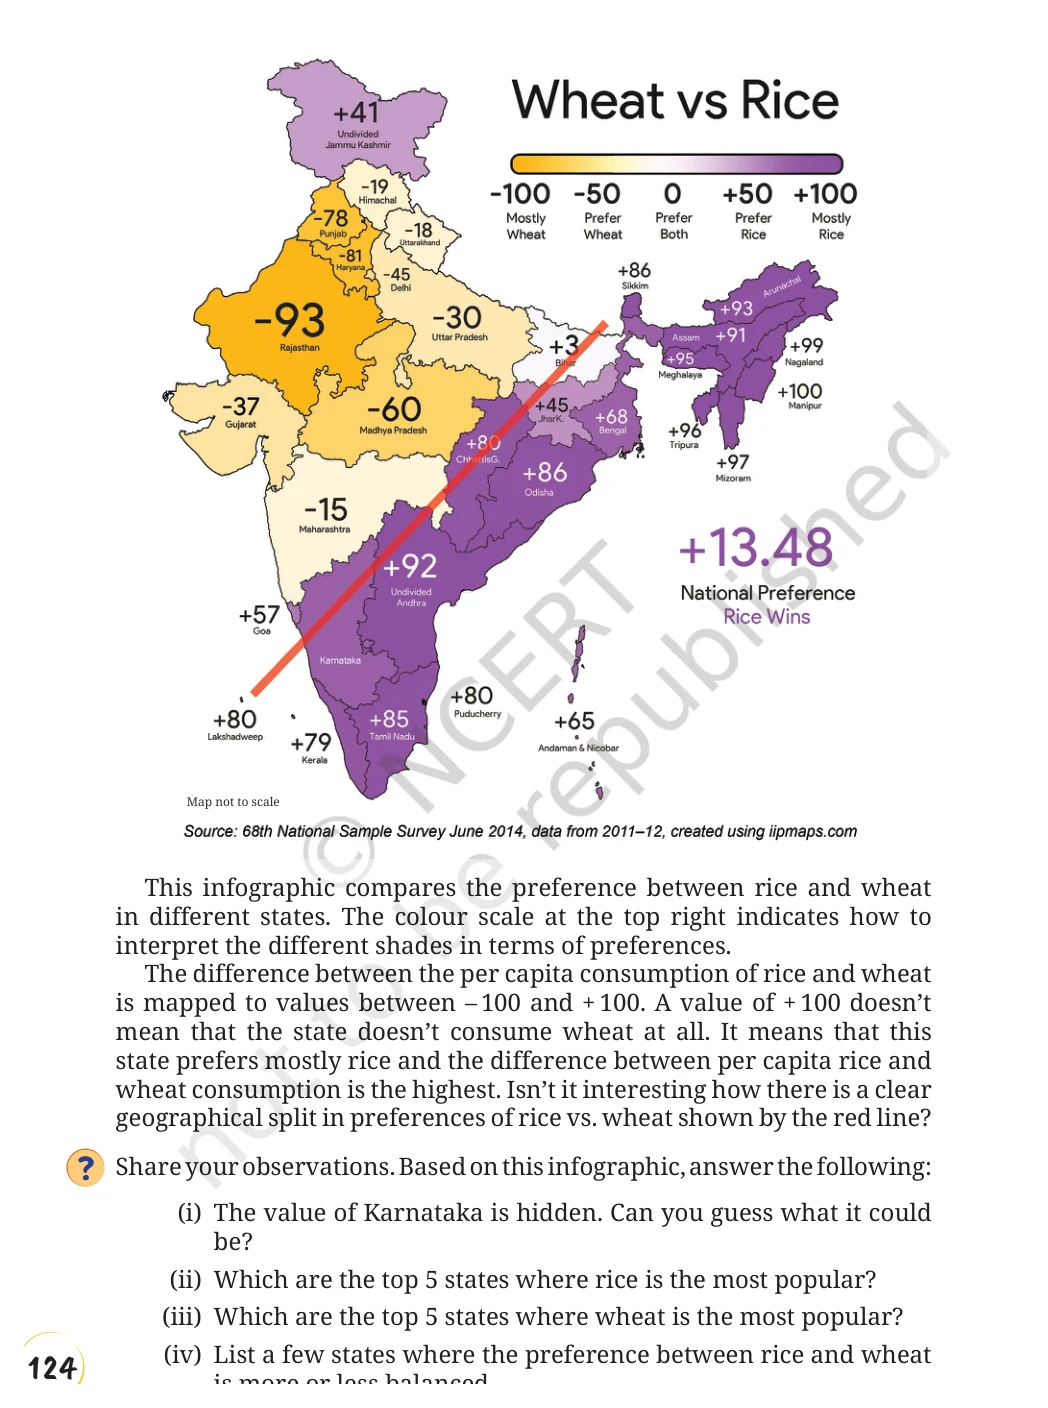
Answer the rice-versus-wheat infographic questions.
Show solution
Karnataka's dark-purple shade suggests roughly +80 to +90, similar to Tamil Nadu (+85) and Andhra (+92). The five strongest displayed rice preferences are Manipur (+100), Nagaland (+99), Mizoram (+97), Tripura (+96), and Meghalaya (+95). The strongest wheat preferences are Rajasthan (-93), Haryana (-81), Punjab (-78), Madhya Pradesh (-60), and Delhi (-45).
More balanced examples include Bihar (+3), Maharashtra (-15), Uttarakhand (-18), Himachal Pradesh (-19), and Uttar Pradesh (-30).
Complete worked answers
Textbook page 23
Textbook page 23 · solved item 32
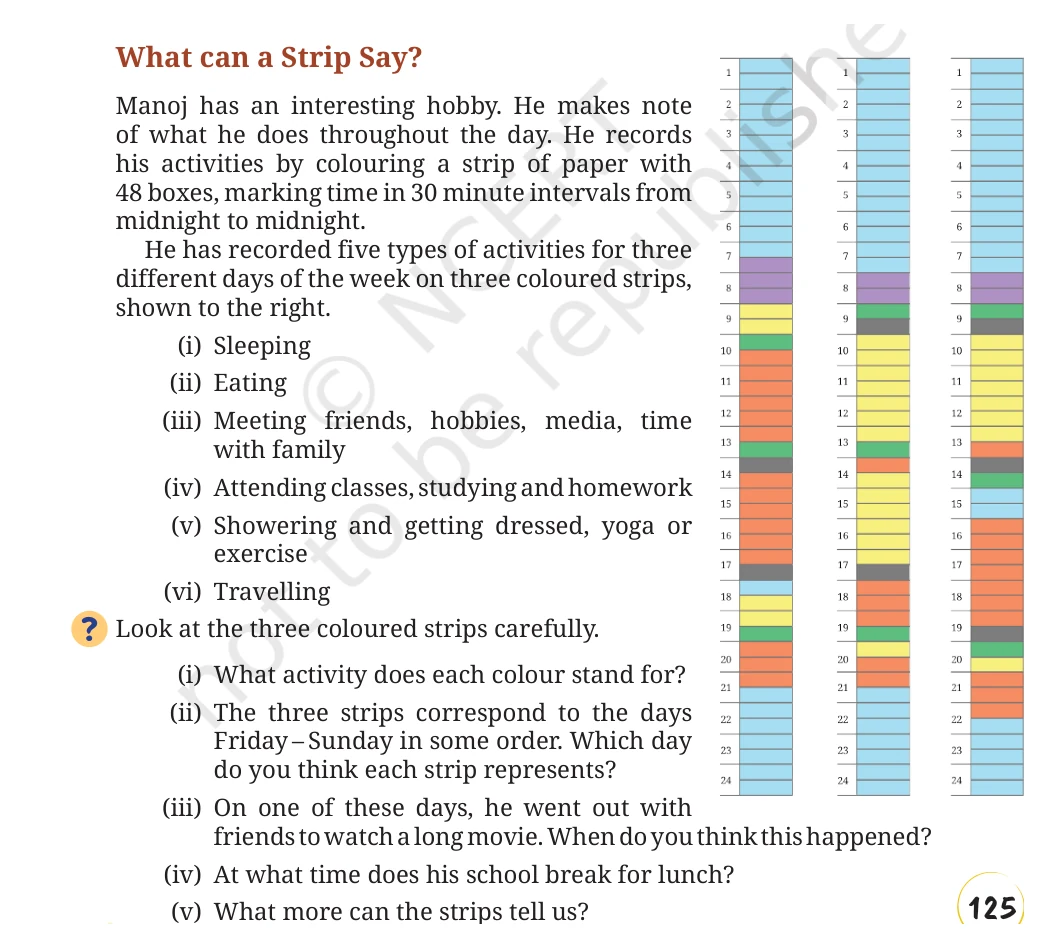
Decode Manoj's three activity strips and identify the days and times.
Show solution
Light blue is sleep; yellow is recreation/friends/media; orange is classes or study; green is eating; purple is washing/dressing/exercise; grey is travel. The strips are Sunday, Saturday, Friday from left to right: the left has no school, the middle has a shorter study block, and the right has the full school day.
The long movie is Sunday about 9:00-13:00. School lunch is about 13:00. The strips also reveal sleep times, commute, meal duration, and how weekday and weekend routines differ.
Complete worked answers
Textbook page 25
Textbook page 25 · solved item 33
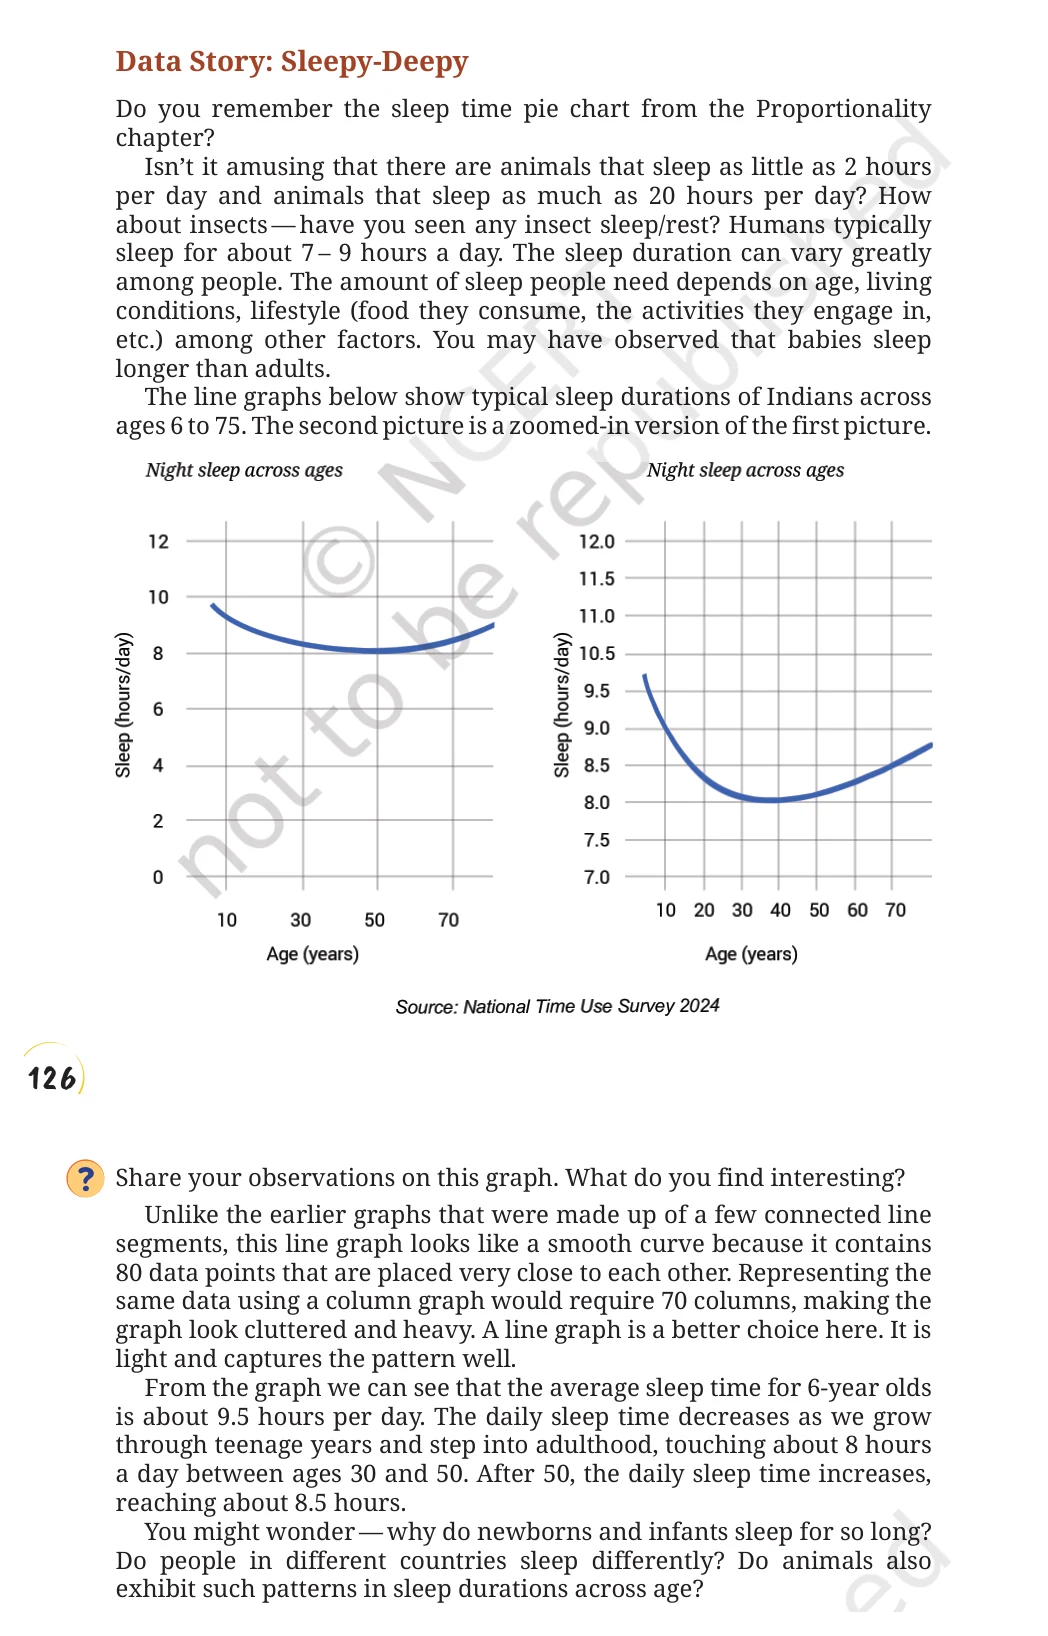
What does the sleep-duration graph show?
Show solution
Average sleep is about 9.5 hours at age 6, falls through childhood and the teenage years, stays near 8 hours through much of adulthood, then rises toward about 8.5 hours in older age. The many closely spaced observations make a smooth line more readable than dozens of columns.
Textbook page 25 · solved item 34
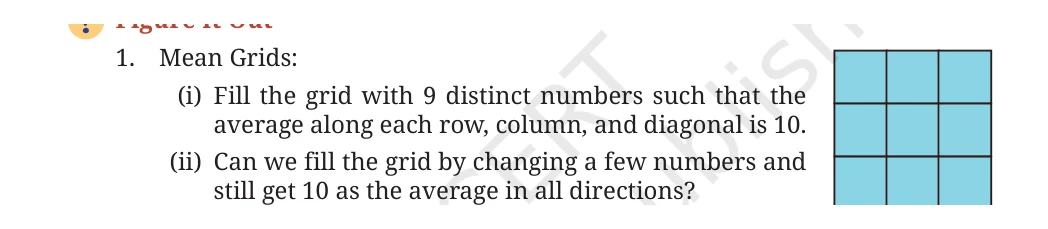
Fill a 3×3 mean grid so every row, column, and diagonal averages 10.
Show solution
Each line must total 30. One solution is 13, 6, 11/8, 10, 12/9, 14, 7. It comes from adding 5 to every entry of the Lo Shu magic square. Rotating or reflecting this grid gives further solutions while keeping nine distinct values.
Textbook page 25 · solved item 35
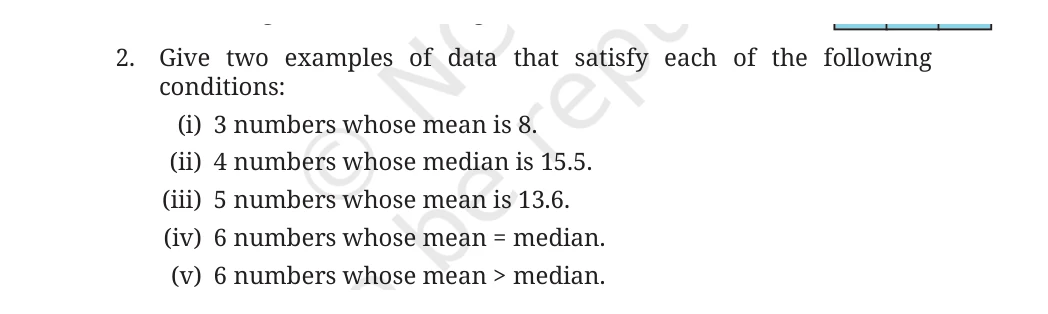
Give two examples for each requested mean and median condition.
Show solution
(i) 6,8,10 and 4,8,12. (ii) 10,15,16,20 and 1,15,16,30. (iii) 10,12,14,15,17 and 8,11,13,16,20. (iv) 1,2,3,3,4,5 and 2,4,6,6,8,10. (v) 1,1,2,2,3,15 and 0,1,1,2,2,18.
Textbook page 25 · solved item 36

Fill three blanks so the median of 5, 21, 14, __, __, __ is 13.
Show solution
For example, use 12, 12, 30. Sorted, the data are 5,12,12,14,21,30, whose median is (12+14)/2 = 13. There are infinitely many possibilities because the last value can be any counting number at least 21 while the two middle positions are preserved.
Textbook page 25 · solved item 37

Fill two blanks so the mean of 3, 11, __, __, 15, 6 is 6.5.
Show solution
The required total is (6\times6.5=39); known values total 35, so the blanks must sum to 4. With positive counting numbers, the ordered pairs are (1,3), (2,2), and (3,1): three placements, or two if order is ignored.
Textbook page 25 · solved item 38
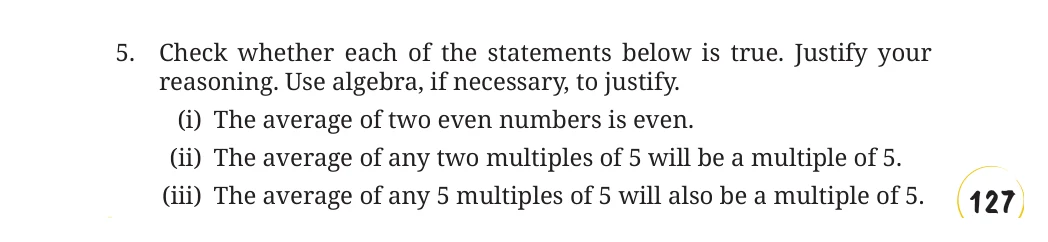
Are the three claims about averages of even numbers and multiples of 5 true?
Show solution
None is always true. Two even numbers can average to an odd number, for example (2+4)/2=3. Two multiples of 5 can average to 7.5, using 5 and 10. Five multiples of 5 can average to a non-multiple of 5, for example 0,5,10,15,25 have mean 11.
Complete worked answers
Textbook page 26
Textbook page 26 · solved item 39
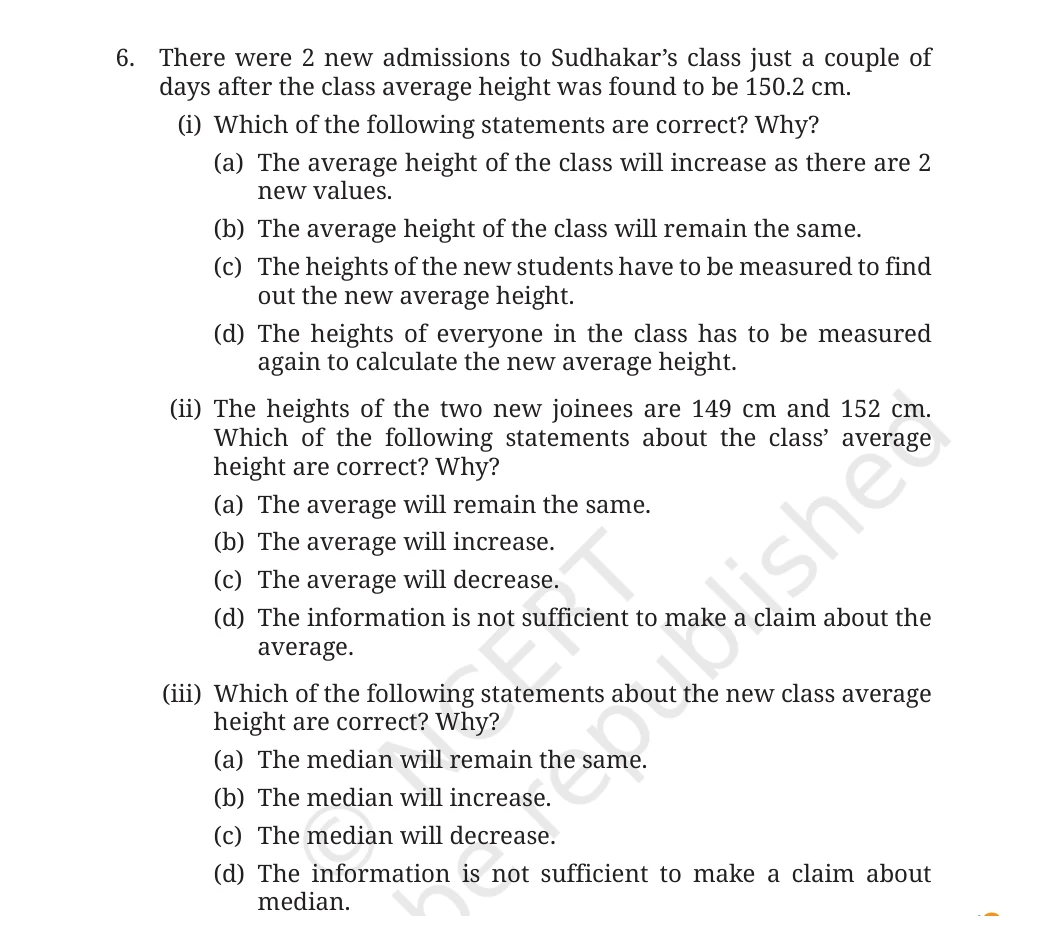
Analyse the two new admissions and the class mean and median.
Show solution
Initially only (c) is necessarily correct: measure the two newcomers and combine their total with the known old total (24\times150.2); no remeasurement is needed. Their mean is ((149+152)/2=150.5), above 150.2, so the class mean increases slightly (choice b). The old data values are not given, so the new median cannot be determined (choice d).
Textbook page 26 · solved item 40
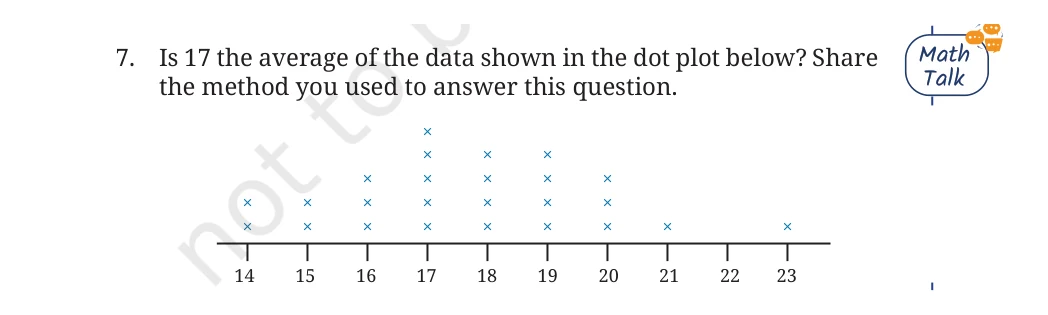
Is 17 the average of the displayed dot plot?
Show solution
No. Counting the dots gives 25 values with total 443, so the mean is (443/25=17.72), not 17. Equivalently, the total rightward deviation from 17 exceeds the total leftward deviation by 18 units.
Textbook page 26 · solved item 41
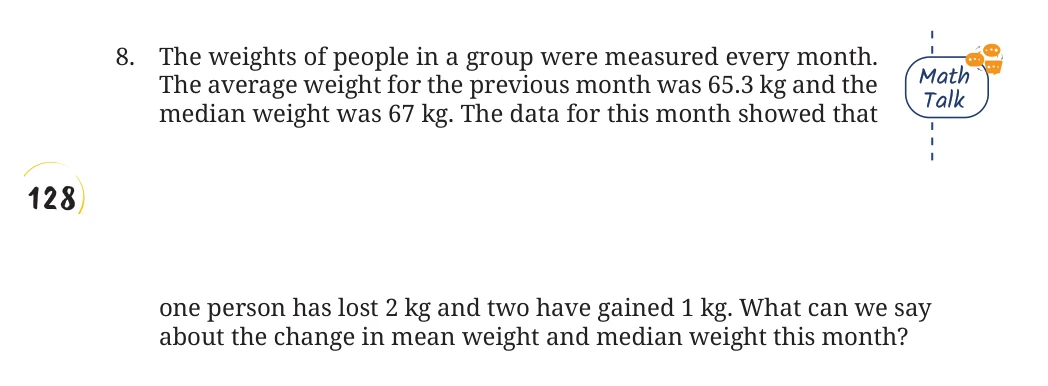
What happens to the group's mean and median after the three weight changes?
Show solution
The total change is -2 + 1 + 1 = 0 kg, so the mean remains 65.3 kg. The median cannot be determined from this information because it depends on which people changed and their positions in the sorted list.
Complete worked answers
Textbook page 27
Textbook page 27 · solved item 42
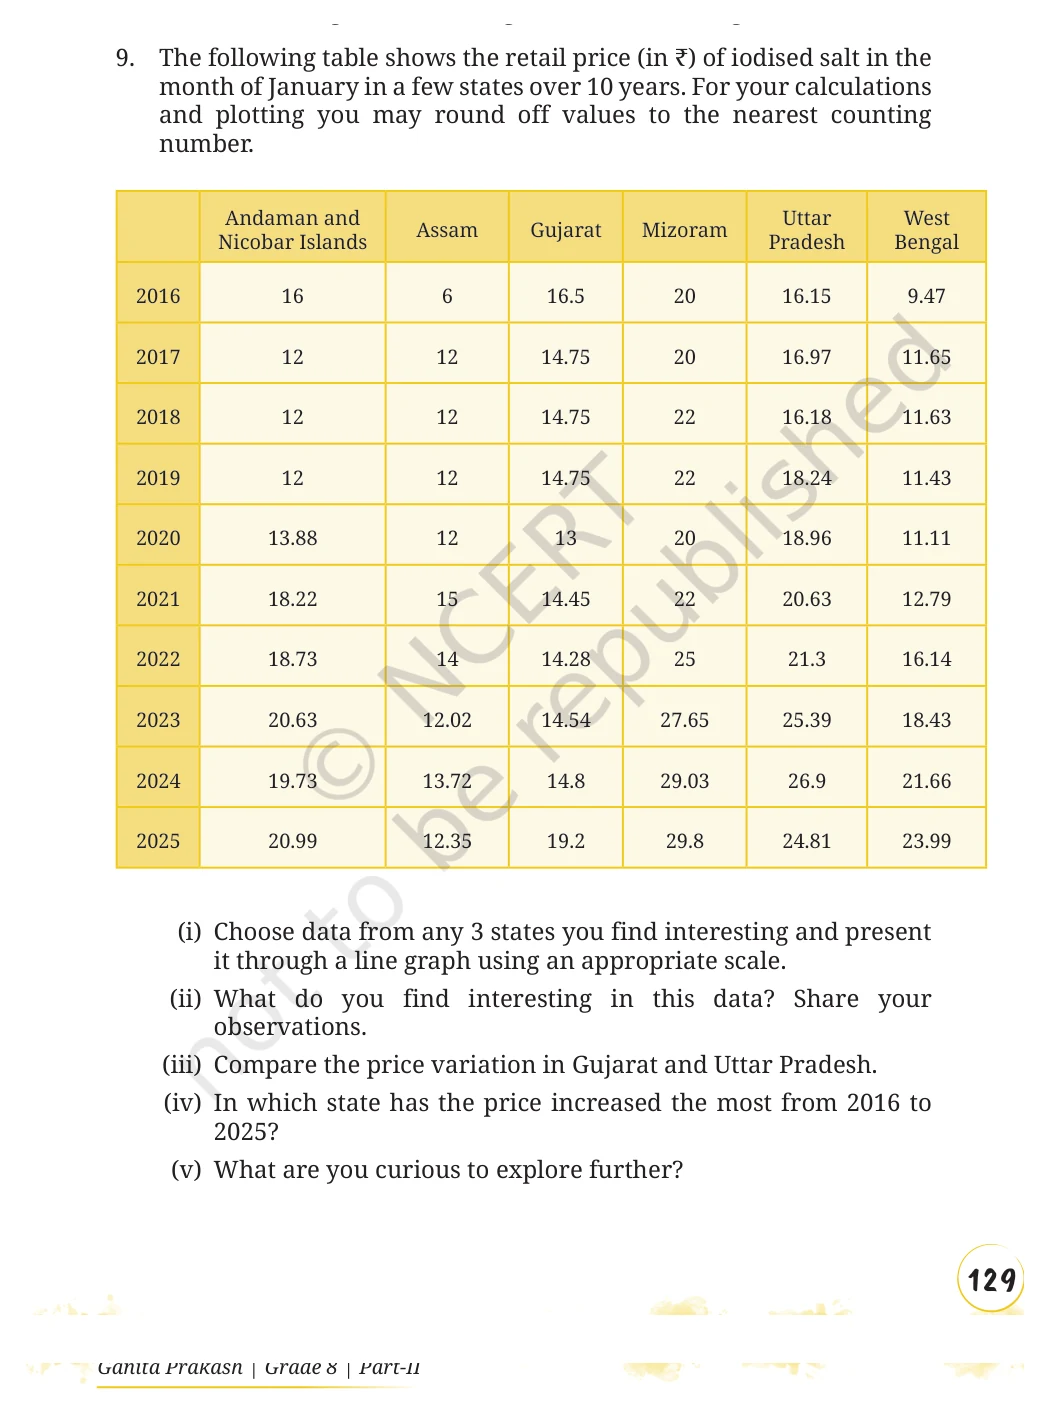
Plot and interpret the iodised-salt price data.
Show solution
Choose any three state rows, put 2016-2025 on the x-axis, and use a common rupee scale. Most series rise overall but fluctuate. Gujarat is fairly flat around ₹13-17 until its 2025 rise to ₹19.20; Uttar Pradesh rises more strongly from ₹16.15 to ₹24.81. West Bengal has the largest 2016-2025 increase: ₹23.99 - ₹9.47 = ₹14.52.
Useful follow-up questions include inflation adjustment and transport or policy effects.
Complete worked answers
Textbook page 28
Textbook page 28 · solved item 43
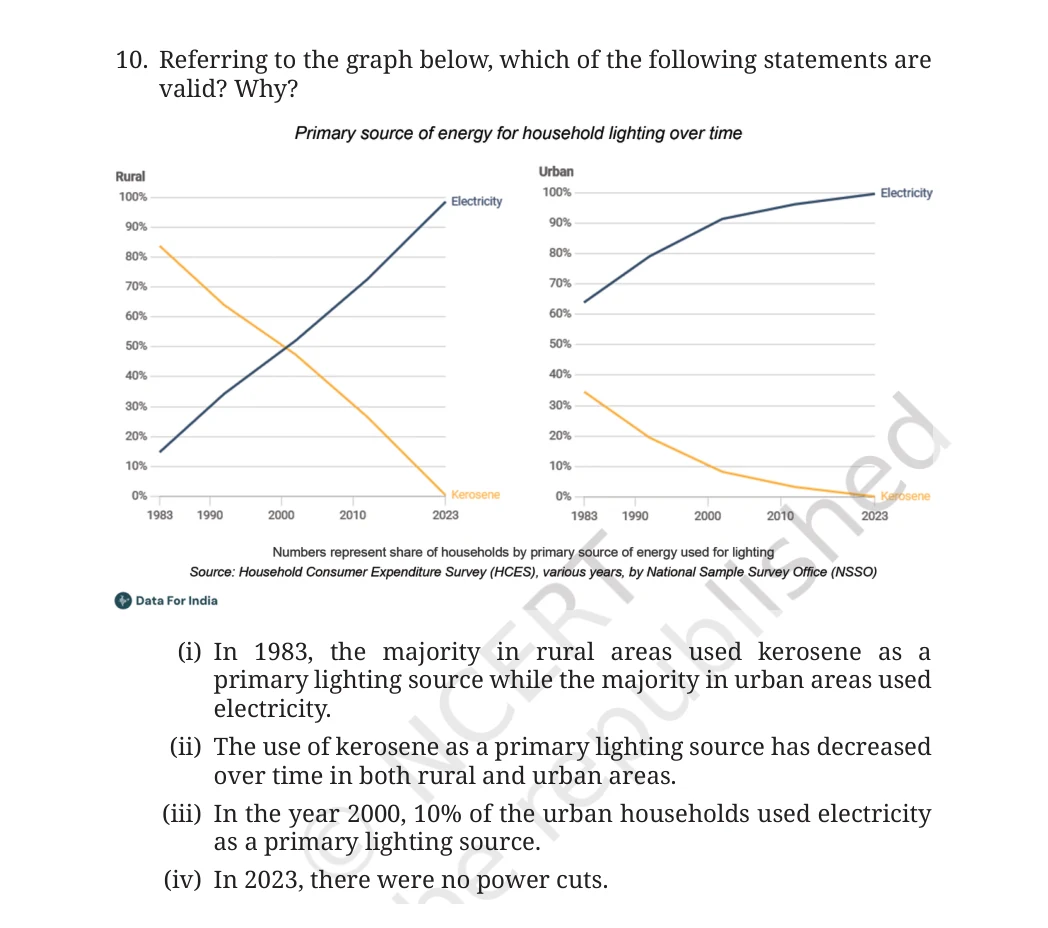
Which lighting-source statements are valid?
Show solution
(i) Valid: in 1983 the rural majority used kerosene while the urban majority used electricity. (ii) Valid: kerosene's share falls over time in both. (iii) Invalid: the graph shows roughly 90%, not 10%, of urban households using electricity in 2000. (iv) Invalid: household primary-source shares do not provide any information about power cuts.
Textbook page 28 · solved item 44
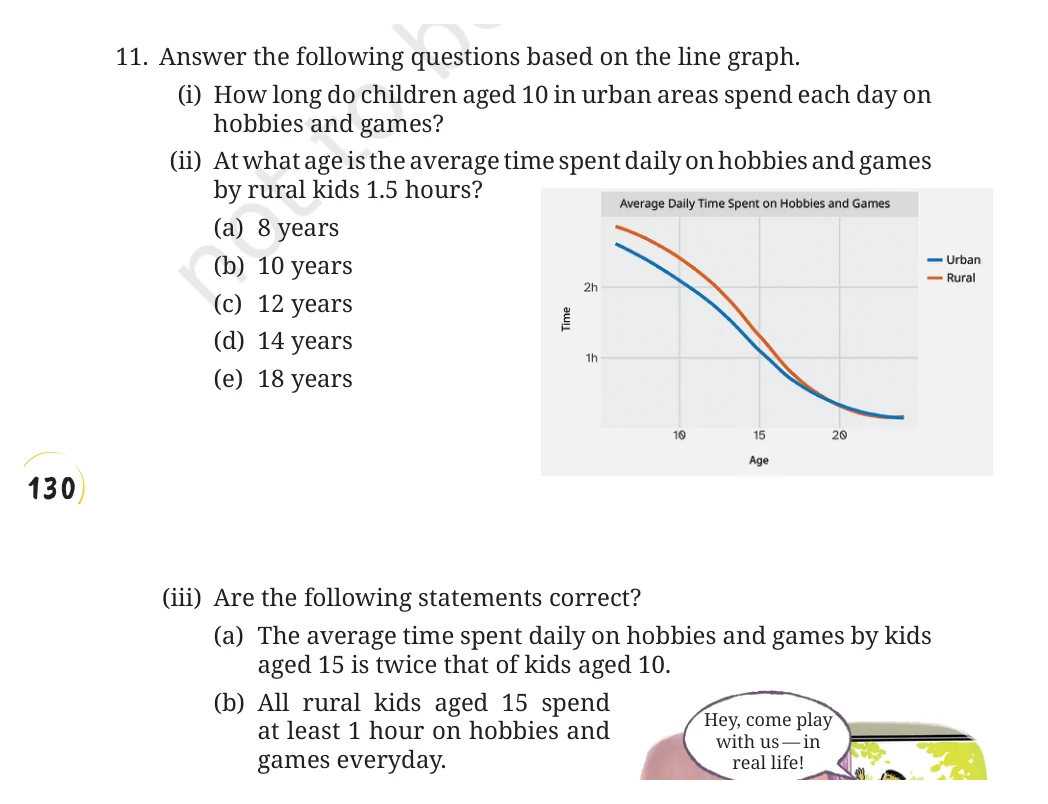
Read the hobbies-and-games line graph and assess its statements.
Show solution
At age 10, urban children spend about 2.1 hours daily. Rural children's average reaches about 1.5 hours at age 14, choice (d). The age-15 average is not twice the age-10 average, so statement (a) is false. Statement (b) is also unsupported: an average above 1 hour does not mean every rural child spends at least 1 hour.
Complete worked answers
Textbook page 29
Textbook page 29 · solved item 45
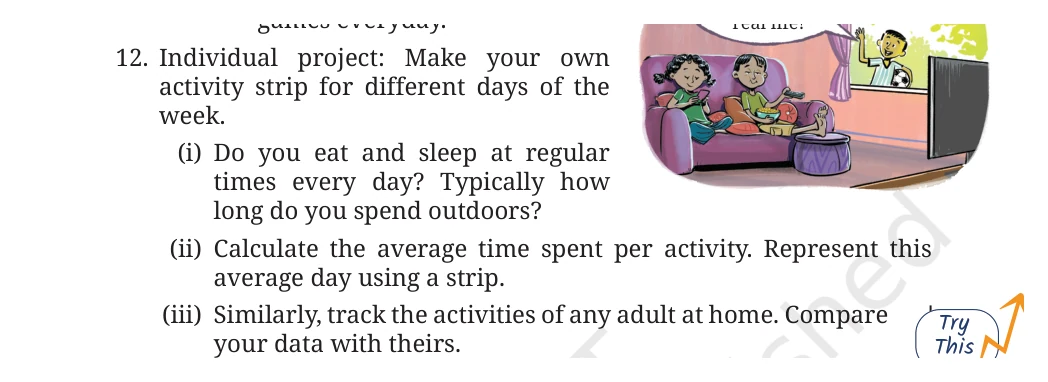
Complete the individual activity-strip project.
Show solution
Use 48 half-hour cells per day and one consistent colour per activity. Total each activity's cells across the observed days, multiply by 0.5 hour, and divide by the number of days. Draw the resulting average-day strip, then repeat for one adult and compare sleep, meals, outdoor time, work/study, travel, and recreation.
Textbook page 29 · solved item 46
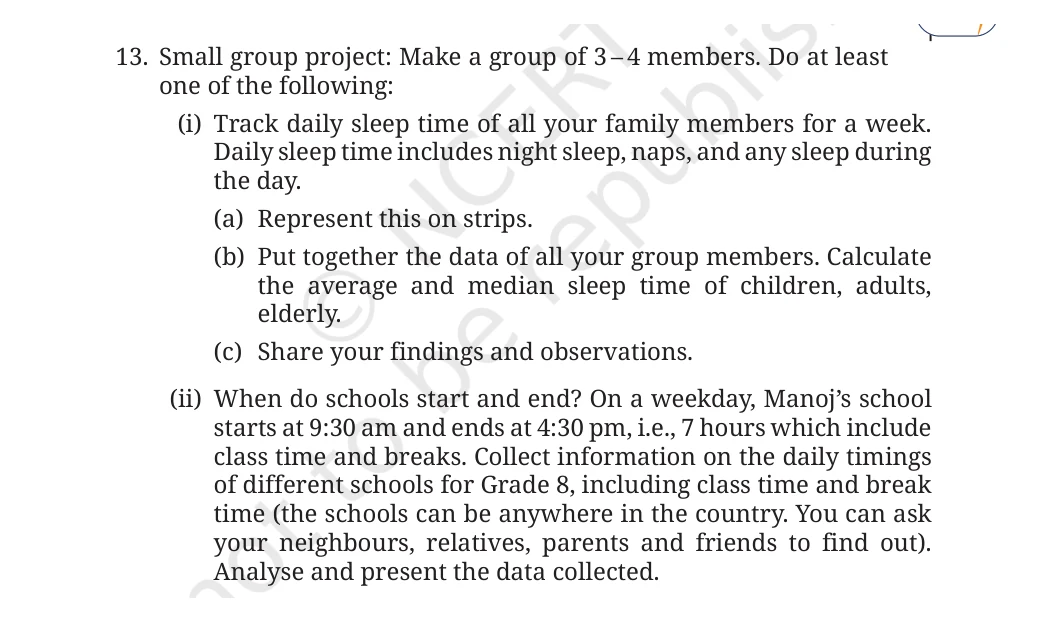
Plan the family-sleep or school-timing group project.
Show solution
Use one row per person or school and fixed columns for date, category, start, end, breaks, and total duration. For sleep, include naps and compute separate child, adult, and elderly means and medians. For schools, compare total school span, class time, and break time. Keep units and definitions consistent, show the distributions with strips or line graphs, and report sample size before conclusions.
Complete worked answers
Textbook page 30
Textbook page 30 · solved item 47
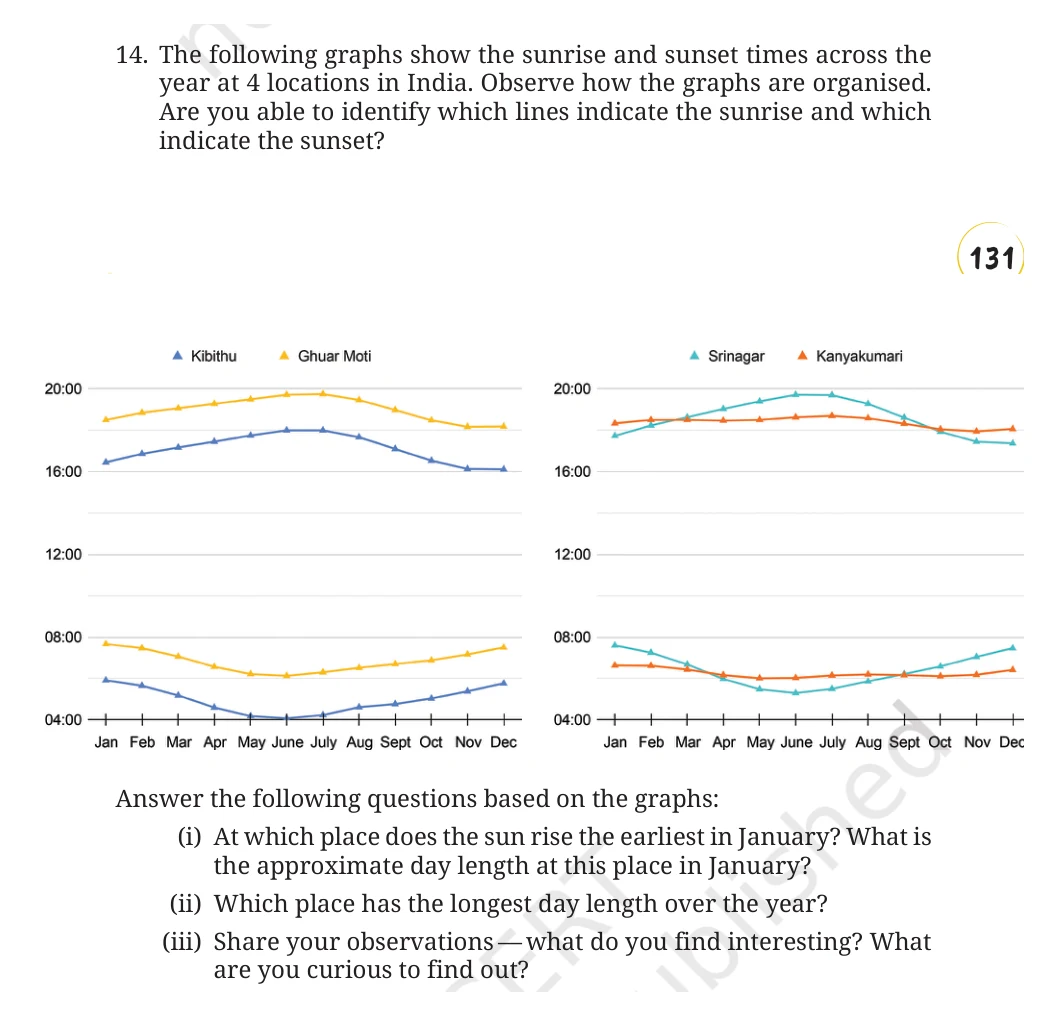
Interpret the sunrise and sunset graphs for four Indian locations.
Show solution
Kibithu has the earliest January sunrise, about 6:00, and sunset around 16:30, giving roughly 10.5 hours of daylight. Srinagar has the longest summer day, about 14.5 hours. Kanyakumari shows the least seasonal change, while the northern locations show a larger summer-winter swing; eastern Kibithu's clock times are earlier than Ghuar Moti's.
Textbook page 30 · solved item 48
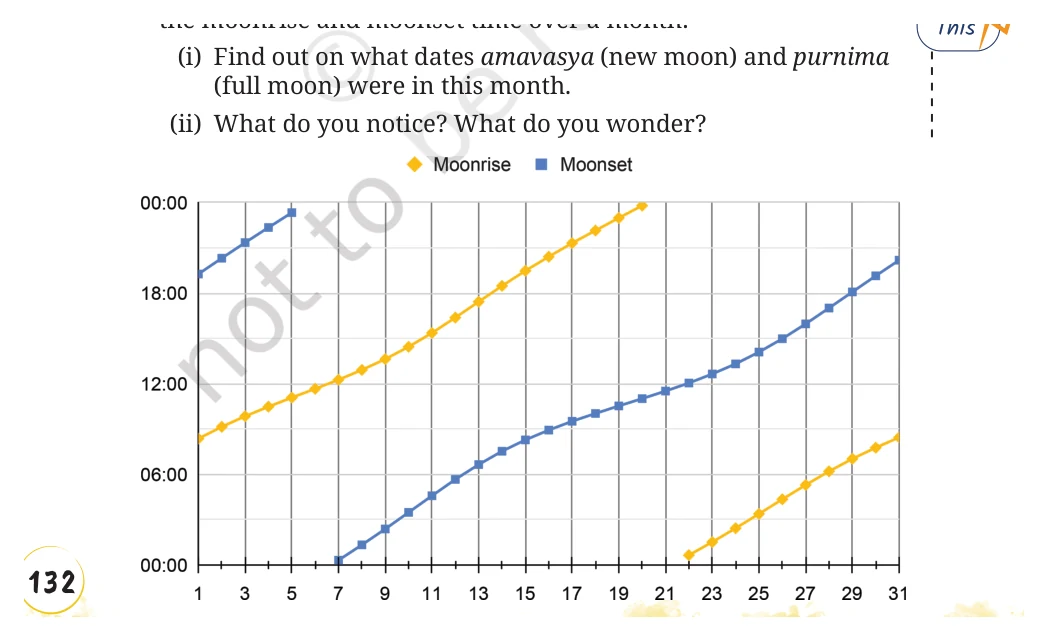
Use the moonrise and moonset graph to locate new moon and full moon.
Show solution
The full moon is around day 6: moonrise is near sunset and moonset near sunrise. The new moon is around day 21: moonrise and moonset are close to sunrise and sunset respectively, shown by the 24-hour wrap in the plotted lines. Both times move later by roughly 45-60 minutes per day, with the apparent breaks caused by wrapping past midnight.
Complete worked answers
Textbook page 32
Textbook page 32 · solved item 49
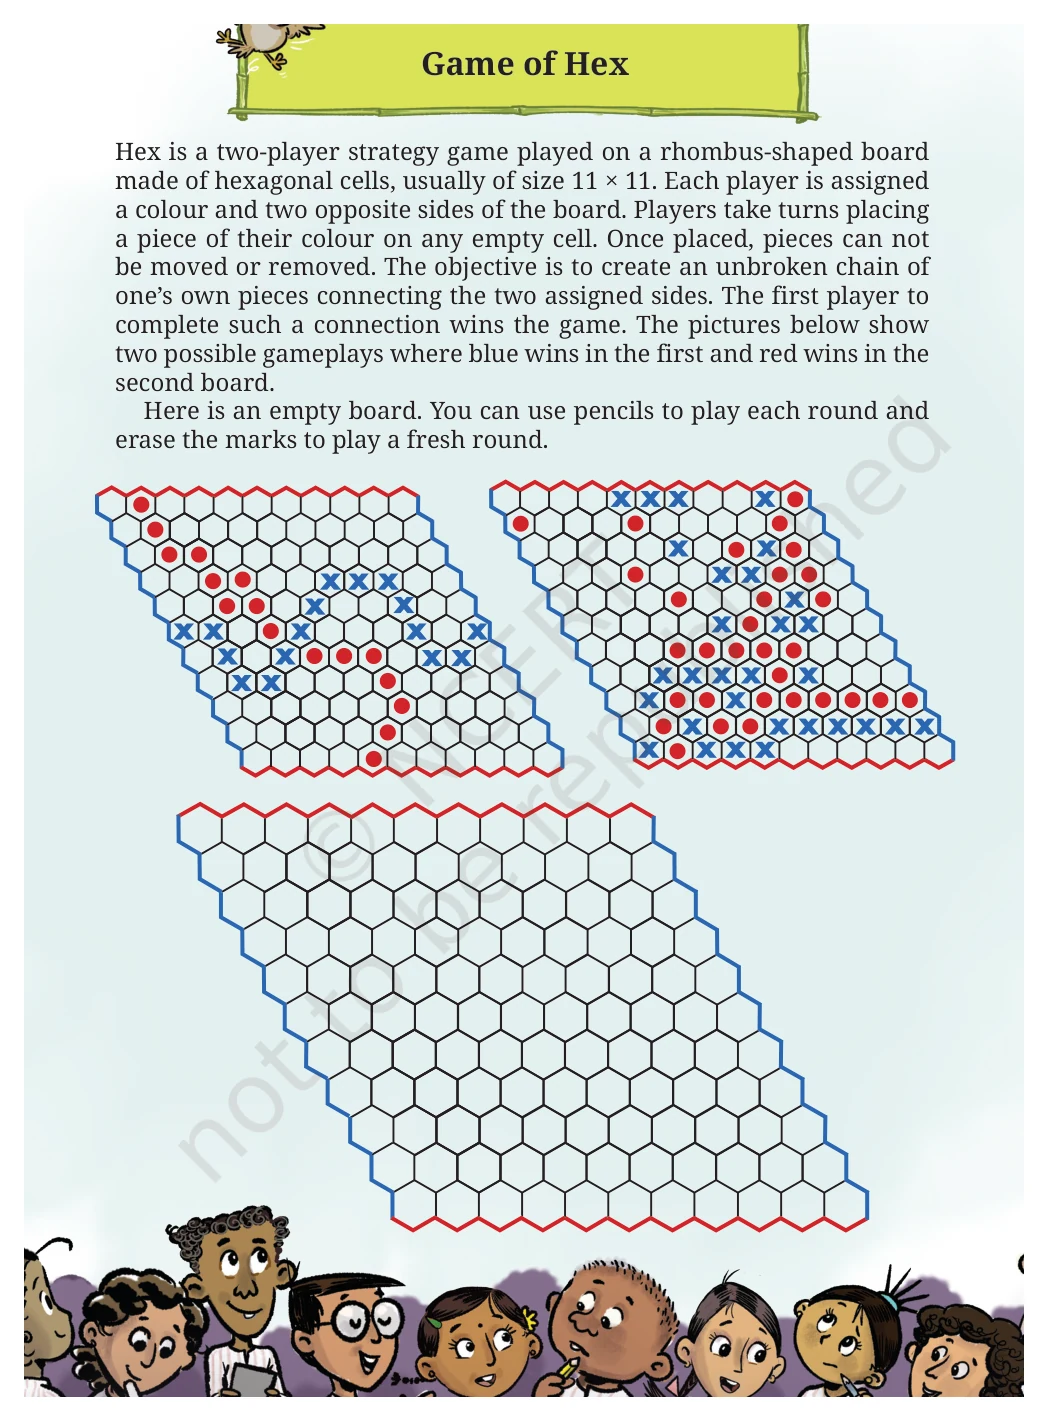
How is the Game of Hex played, and what is a useful strategy?
Show solution
Two players alternately claim empty hexagons. Each tries to make one continuous chain joining their assigned opposite sides; pieces never move and the first completed connection wins. A useful strategy is to create two separated routes that cannot both be blocked with one move, while watching for the opponent's analogous bridge connections.